| Full name: eva-1 homolog C | Alias Symbol: B18|PRED34|B19 | ||
| Type: protein-coding gene | Cytoband: 21q22.11 | ||
| Entrez ID: 59271 | HGNC ID: HGNC:13239 | Ensembl Gene: ENSG00000166979 | OMIM ID: |
Expression of EVA1C:
| Dataset | Gene | EntrezID | Probe | Log2FC | Adj.pValue | Expression |
|---|---|---|---|---|---|---|
| GSE17351 | EVA1C | 59271 | 227188_at | -0.5914 | 0.3104 | |
| GSE26886 | EVA1C | 59271 | 227188_at | 0.5082 | 0.1911 | |
| GSE45670 | EVA1C | 59271 | 227188_at | -0.5207 | 0.0191 | |
| GSE53622 | EVA1C | 59271 | 59871 | -0.6030 | 0.0000 | |
| GSE53624 | EVA1C | 59271 | 16600 | -0.7178 | 0.0000 | |
| GSE63941 | EVA1C | 59271 | 227188_at | 1.3948 | 0.1654 | |
| GSE77861 | EVA1C | 59271 | 227188_at | 0.0871 | 0.8760 | |
| SRP007169 | EVA1C | 59271 | RNAseq | -0.8709 | 0.1728 | |
| SRP008496 | EVA1C | 59271 | RNAseq | -0.4292 | 0.3487 | |
| SRP064894 | EVA1C | 59271 | RNAseq | 0.0258 | 0.9460 | |
| SRP133303 | EVA1C | 59271 | RNAseq | -0.9698 | 0.0020 | |
| SRP159526 | EVA1C | 59271 | RNAseq | -0.4686 | 0.2129 | |
| SRP193095 | EVA1C | 59271 | RNAseq | 0.0230 | 0.9048 | |
| SRP219564 | EVA1C | 59271 | RNAseq | 0.2235 | 0.6522 |
Upregulated datasets: 0; Downregulated datasets: 0.
Survival by EVA1C expression:
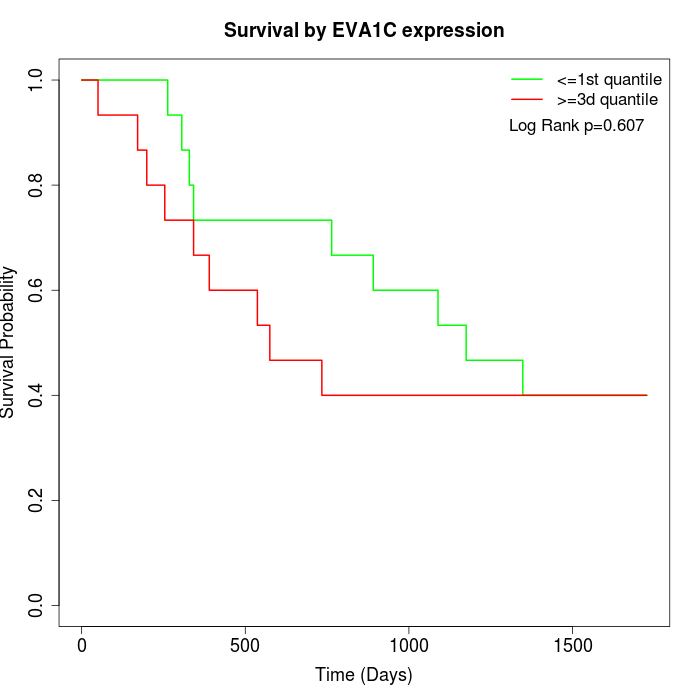 | 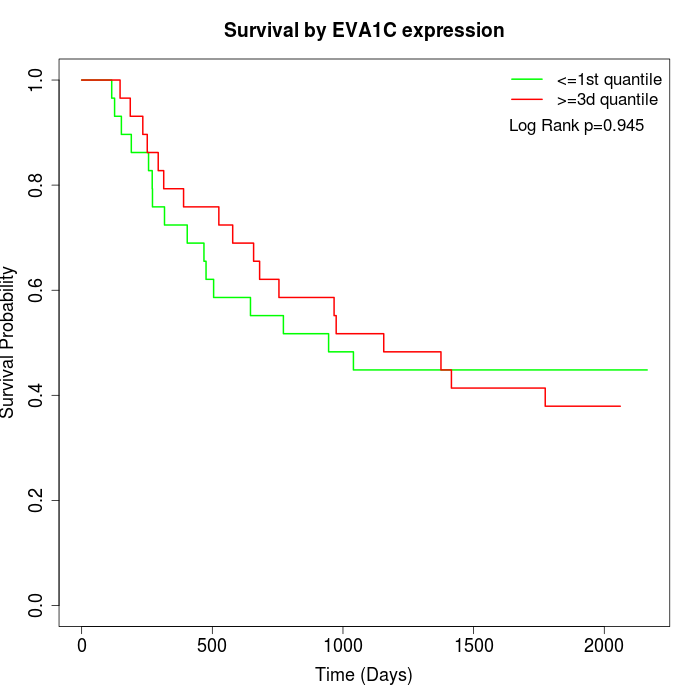 |
| GSE53622 | GSE53624 |
Note: Click image to view full size file.
Copy number change of EVA1C:
| Dataset | Gene | EntrezID | Gain | Loss | Normal | Detail |
|---|---|---|---|---|---|---|
| GSE15526 | EVA1C | 59271 | 2 | 9 | 19 | |
| GSE20123 | EVA1C | 59271 | 2 | 10 | 18 | |
| GSE43470 | EVA1C | 59271 | 3 | 7 | 33 | |
| GSE46452 | EVA1C | 59271 | 1 | 21 | 37 | |
| GSE47630 | EVA1C | 59271 | 6 | 17 | 17 | |
| GSE54993 | EVA1C | 59271 | 9 | 1 | 60 | |
| GSE54994 | EVA1C | 59271 | 1 | 8 | 44 | |
| GSE60625 | EVA1C | 59271 | 0 | 0 | 11 | |
| GSE74703 | EVA1C | 59271 | 3 | 5 | 28 | |
| GSE74704 | EVA1C | 59271 | 1 | 5 | 14 | |
| TCGA | EVA1C | 59271 | 9 | 36 | 51 |
Total number of gains: 37; Total number of losses: 119; Total Number of normals: 332.
Somatic mutations of EVA1C:
Generating mutation plots.
Highly correlated genes for EVA1C:
Showing all 20 correlated genes with mean PCC>0.5.
| Gene1 | Gene2 | Mean PCC | Num. Datasets | Num. PCC<0 | Num. PCC>0.5 |
|---|---|---|---|---|---|
| EVA1C | CEP68 | 0.651792 | 4 | 0 | 4 |
| EVA1C | FAM107A | 0.57133 | 4 | 0 | 3 |
| EVA1C | SUSD4 | 0.561229 | 5 | 0 | 4 |
| EVA1C | TGFBR3 | 0.560688 | 4 | 0 | 3 |
| EVA1C | MATN1-AS1 | 0.549512 | 3 | 0 | 3 |
| EVA1C | CLU | 0.543425 | 4 | 0 | 3 |
| EVA1C | GTF2A1L | 0.543328 | 3 | 0 | 3 |
| EVA1C | NDRG2 | 0.530563 | 4 | 0 | 3 |
| EVA1C | CACNG4 | 0.529606 | 3 | 0 | 3 |
| EVA1C | CYP4F3 | 0.528414 | 5 | 0 | 3 |
| EVA1C | TPPP | 0.518076 | 4 | 0 | 3 |
| EVA1C | SCARA3 | 0.516217 | 6 | 0 | 3 |
| EVA1C | GCNT2 | 0.51513 | 6 | 0 | 3 |
| EVA1C | SMOC2 | 0.515103 | 5 | 0 | 3 |
| EVA1C | ALDH3A1 | 0.514226 | 6 | 0 | 3 |
| EVA1C | MYRIP | 0.509969 | 4 | 0 | 3 |
| EVA1C | APOD | 0.509962 | 5 | 0 | 3 |
| EVA1C | CXCL12 | 0.509207 | 5 | 0 | 3 |
| EVA1C | MCF2L | 0.504485 | 5 | 0 | 3 |
| EVA1C | SVIL | 0.50105 | 6 | 0 | 3 |
For details and further investigation, click here