| Full name: F2R like thrombin or trypsin receptor 3 | Alias Symbol: PAR4 | ||
| Type: protein-coding gene | Cytoband: 19p13.11 | ||
| Entrez ID: 9002 | HGNC ID: HGNC:3540 | Ensembl Gene: ENSG00000127533 | OMIM ID: 602779 |
| Related drugs: IODIPAMIDE, LANSOPRAZOLE, NAFCILLIN, RUSALATIDE, TRIFLUSAL, VORAPAXAR... [more] | |||
F2RL3 involved pathways:
| KEGG pathway | Description | View |
|---|---|---|
| hsa04015 | Rap1 signaling pathway | |
| hsa04610 | Complement and coagulation cascades | |
| hsa04611 | Platelet activation |
Expression of F2RL3:
| Dataset | Gene | EntrezID | Probe | Log2FC | Adj.pValue | Expression |
|---|---|---|---|---|---|---|
| GSE17351 | F2RL3 | 9002 | 207221_at | -0.0787 | 0.7993 | |
| GSE20347 | F2RL3 | 9002 | 207221_at | 0.1011 | 0.1693 | |
| GSE23400 | F2RL3 | 9002 | 207221_at | -0.0197 | 0.3634 | |
| GSE26886 | F2RL3 | 9002 | 207221_at | 0.0640 | 0.6557 | |
| GSE29001 | F2RL3 | 9002 | 207221_at | 0.0647 | 0.6733 | |
| GSE38129 | F2RL3 | 9002 | 207221_at | 0.0355 | 0.5721 | |
| GSE45670 | F2RL3 | 9002 | 207221_at | 0.0840 | 0.2330 | |
| GSE53622 | F2RL3 | 9002 | 109727 | 0.3964 | 0.0060 | |
| GSE53624 | F2RL3 | 9002 | 109727 | 0.2500 | 0.0163 | |
| GSE63941 | F2RL3 | 9002 | 207221_at | 0.0917 | 0.5825 | |
| GSE77861 | F2RL3 | 9002 | 207221_at | -0.0091 | 0.9441 | |
| GSE97050 | F2RL3 | 9002 | A_33_P3232955 | -0.0516 | 0.8319 | |
| SRP007169 | F2RL3 | 9002 | RNAseq | 1.4569 | 0.1197 | |
| SRP064894 | F2RL3 | 9002 | RNAseq | 1.5896 | 0.0000 | |
| SRP133303 | F2RL3 | 9002 | RNAseq | 0.1002 | 0.5114 | |
| SRP159526 | F2RL3 | 9002 | RNAseq | 0.6849 | 0.2121 | |
| SRP193095 | F2RL3 | 9002 | RNAseq | 0.2167 | 0.0979 | |
| SRP219564 | F2RL3 | 9002 | RNAseq | 0.7753 | 0.0593 | |
| TCGA | F2RL3 | 9002 | RNAseq | -0.9246 | 0.0000 |
Upregulated datasets: 1; Downregulated datasets: 0.
Survival by F2RL3 expression:
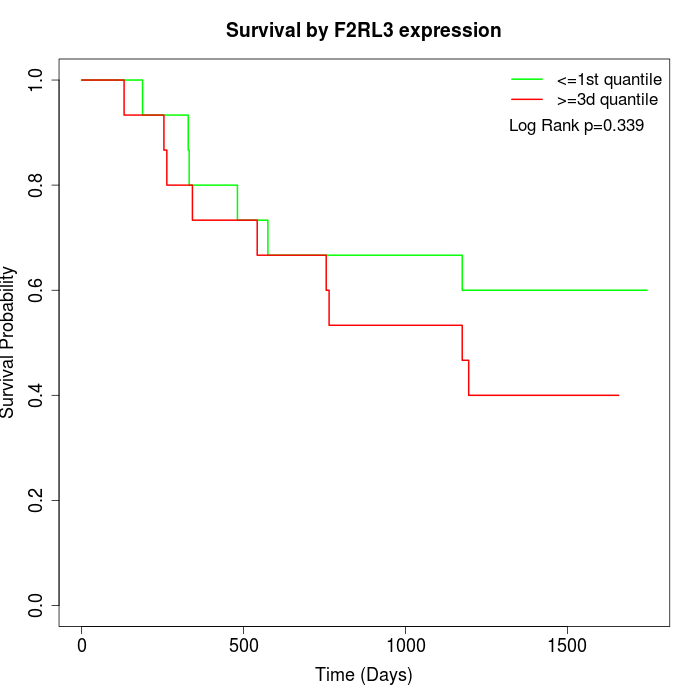 | 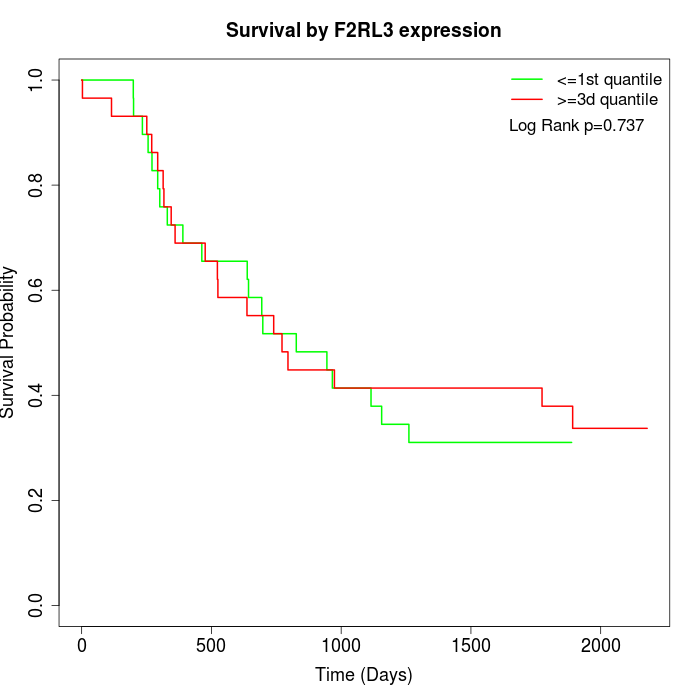 | 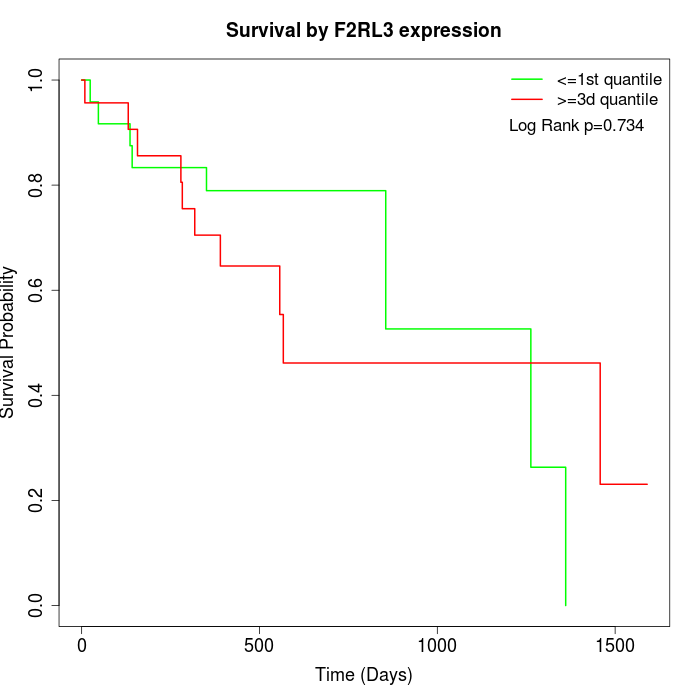 |
| GSE53622 | GSE53624 | TCGA |
Note: Click image to view full size file.
Copy number change of F2RL3:
| Dataset | Gene | EntrezID | Gain | Loss | Normal | Detail |
|---|---|---|---|---|---|---|
| GSE15526 | F2RL3 | 9002 | 4 | 3 | 23 | |
| GSE20123 | F2RL3 | 9002 | 3 | 2 | 25 | |
| GSE43470 | F2RL3 | 9002 | 2 | 6 | 35 | |
| GSE46452 | F2RL3 | 9002 | 47 | 1 | 11 | |
| GSE47630 | F2RL3 | 9002 | 4 | 8 | 28 | |
| GSE54993 | F2RL3 | 9002 | 15 | 4 | 51 | |
| GSE54994 | F2RL3 | 9002 | 6 | 14 | 33 | |
| GSE60625 | F2RL3 | 9002 | 9 | 0 | 2 | |
| GSE74703 | F2RL3 | 9002 | 2 | 4 | 30 | |
| GSE74704 | F2RL3 | 9002 | 0 | 1 | 19 | |
| TCGA | F2RL3 | 9002 | 17 | 9 | 70 |
Total number of gains: 109; Total number of losses: 52; Total Number of normals: 327.
Somatic mutations of F2RL3:
Generating mutation plots.
Highly correlated genes for F2RL3:
Showing top 20/828 corelated genes with mean PCC>0.5.
| Gene1 | Gene2 | Mean PCC | Num. Datasets | Num. PCC<0 | Num. PCC>0.5 |
|---|---|---|---|---|---|
| F2RL3 | C9orf153 | 0.868065 | 3 | 0 | 3 |
| F2RL3 | WDR87 | 0.858851 | 3 | 0 | 3 |
| F2RL3 | STRC | 0.842888 | 3 | 0 | 3 |
| F2RL3 | KRTAP10-12 | 0.841445 | 3 | 0 | 3 |
| F2RL3 | YY2 | 0.832744 | 3 | 0 | 3 |
| F2RL3 | RBM43 | 0.831627 | 3 | 0 | 3 |
| F2RL3 | LINC01122 | 0.830497 | 3 | 0 | 3 |
| F2RL3 | SYCN | 0.830252 | 3 | 0 | 3 |
| F2RL3 | CNOT3 | 0.828306 | 3 | 0 | 3 |
| F2RL3 | GHSR | 0.813141 | 4 | 0 | 4 |
| F2RL3 | PLA2G2C | 0.809166 | 3 | 0 | 3 |
| F2RL3 | SPRED3 | 0.806091 | 4 | 0 | 4 |
| F2RL3 | DCDC1 | 0.796789 | 3 | 0 | 3 |
| F2RL3 | SPTA1 | 0.792596 | 3 | 0 | 3 |
| F2RL3 | ZNF527 | 0.789376 | 4 | 0 | 4 |
| F2RL3 | OPTC | 0.787923 | 3 | 0 | 3 |
| F2RL3 | LINC00862 | 0.779977 | 3 | 0 | 3 |
| F2RL3 | DEFB128 | 0.774059 | 3 | 0 | 3 |
| F2RL3 | SPACA3 | 0.771383 | 4 | 0 | 4 |
| F2RL3 | LBX2 | 0.769019 | 3 | 0 | 3 |
For details and further investigation, click here