| Full name: fructose-bisphosphatase 1 | Alias Symbol: | ||
| Type: protein-coding gene | Cytoband: 9q22.32 | ||
| Entrez ID: 2203 | HGNC ID: HGNC:3606 | Ensembl Gene: ENSG00000165140 | OMIM ID: 611570 |
FBP1 involved pathways:
| KEGG pathway | Description | View |
|---|---|---|
| hsa04152 | AMPK signaling pathway | |
| hsa04910 | Insulin signaling pathway | |
| hsa04922 | Glucagon signaling pathway |
Expression of FBP1:
| Dataset | Gene | EntrezID | Probe | Log2FC | Adj.pValue | Expression |
|---|---|---|---|---|---|---|
| GSE17351 | FBP1 | 2203 | 209696_at | 0.6951 | 0.3022 | |
| GSE20347 | FBP1 | 2203 | 209696_at | 0.0708 | 0.5605 | |
| GSE23400 | FBP1 | 2203 | 209696_at | 0.1729 | 0.0724 | |
| GSE26886 | FBP1 | 2203 | 209696_at | 0.0389 | 0.8777 | |
| GSE29001 | FBP1 | 2203 | 209696_at | -0.0103 | 0.9620 | |
| GSE38129 | FBP1 | 2203 | 209696_at | 0.2424 | 0.3702 | |
| GSE45670 | FBP1 | 2203 | 209696_at | -0.1323 | 0.2916 | |
| GSE53622 | FBP1 | 2203 | 93499 | 0.3014 | 0.2033 | |
| GSE53624 | FBP1 | 2203 | 93499 | 0.1186 | 0.5452 | |
| GSE63941 | FBP1 | 2203 | 209696_at | 0.5125 | 0.6067 | |
| GSE77861 | FBP1 | 2203 | 209696_at | 0.0653 | 0.6351 | |
| GSE97050 | FBP1 | 2203 | A_23_P257111 | -0.0129 | 0.9770 | |
| SRP007169 | FBP1 | 2203 | RNAseq | 2.8590 | 0.0003 | |
| SRP064894 | FBP1 | 2203 | RNAseq | 1.9102 | 0.0001 | |
| SRP133303 | FBP1 | 2203 | RNAseq | 1.0074 | 0.0001 | |
| SRP159526 | FBP1 | 2203 | RNAseq | -0.9640 | 0.2114 | |
| SRP219564 | FBP1 | 2203 | RNAseq | 1.4699 | 0.0046 | |
| TCGA | FBP1 | 2203 | RNAseq | -0.9128 | 0.0000 |
Upregulated datasets: 4; Downregulated datasets: 0.
Survival by FBP1 expression:
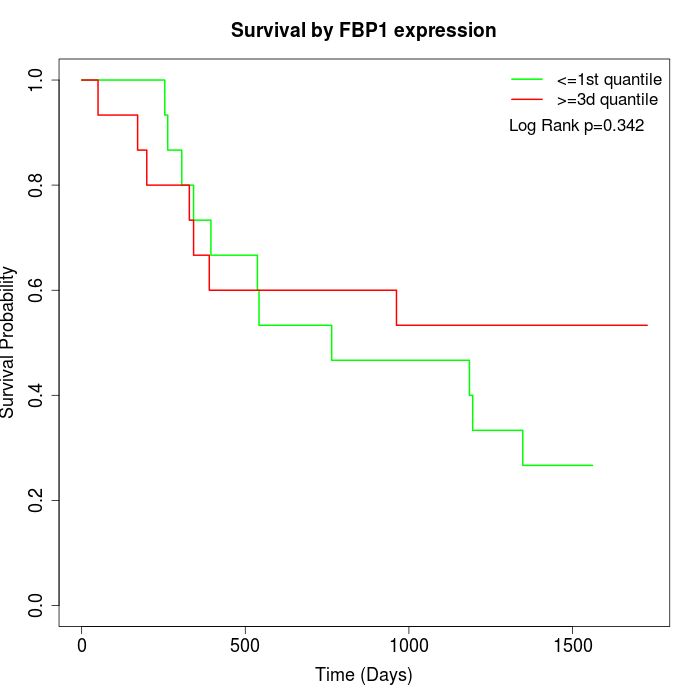 | 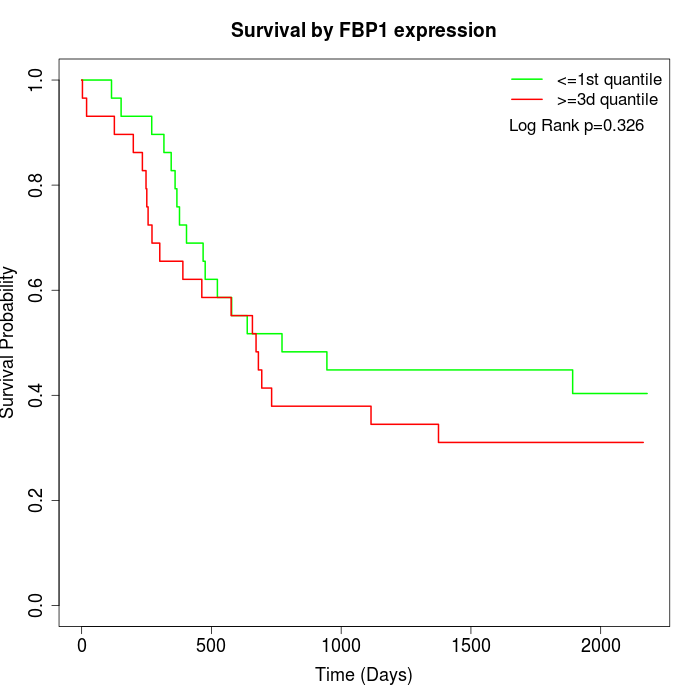 | 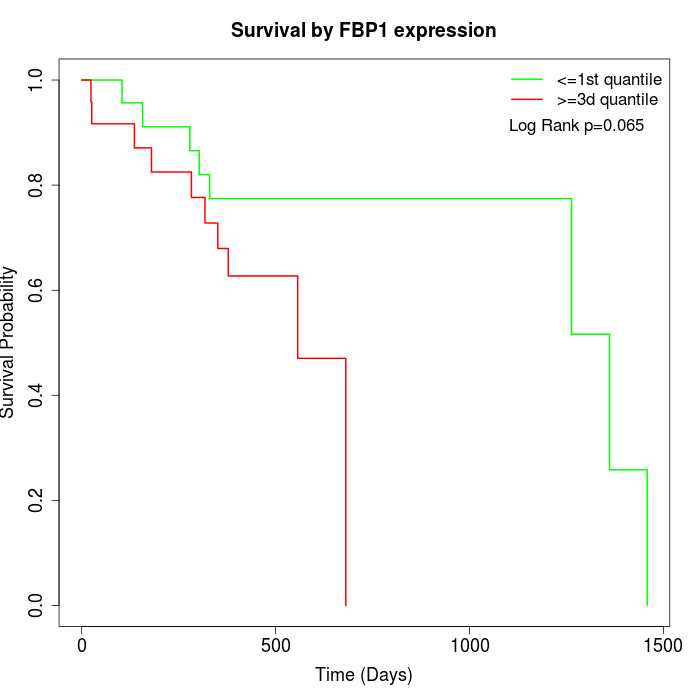 |
| GSE53622 | GSE53624 | TCGA |
Note: Click image to view full size file.
Copy number change of FBP1:
| Dataset | Gene | EntrezID | Gain | Loss | Normal | Detail |
|---|---|---|---|---|---|---|
| GSE15526 | FBP1 | 2203 | 5 | 8 | 17 | |
| GSE20123 | FBP1 | 2203 | 5 | 8 | 17 | |
| GSE43470 | FBP1 | 2203 | 6 | 3 | 34 | |
| GSE46452 | FBP1 | 2203 | 6 | 14 | 39 | |
| GSE47630 | FBP1 | 2203 | 1 | 17 | 22 | |
| GSE54993 | FBP1 | 2203 | 4 | 2 | 64 | |
| GSE54994 | FBP1 | 2203 | 8 | 11 | 34 | |
| GSE60625 | FBP1 | 2203 | 0 | 0 | 11 | |
| GSE74703 | FBP1 | 2203 | 5 | 3 | 28 | |
| GSE74704 | FBP1 | 2203 | 2 | 6 | 12 | |
| TCGA | FBP1 | 2203 | 24 | 23 | 49 |
Total number of gains: 66; Total number of losses: 95; Total Number of normals: 327.
Somatic mutations of FBP1:
Generating mutation plots.
Highly correlated genes for FBP1:
Showing top 20/46 corelated genes with mean PCC>0.5.
| Gene1 | Gene2 | Mean PCC | Num. Datasets | Num. PCC<0 | Num. PCC>0.5 |
|---|---|---|---|---|---|
| FBP1 | NECAB3 | 0.744488 | 3 | 0 | 3 |
| FBP1 | MORN3 | 0.739025 | 3 | 0 | 3 |
| FBP1 | EFNA4 | 0.714024 | 3 | 0 | 3 |
| FBP1 | IL12RB2 | 0.713782 | 3 | 0 | 3 |
| FBP1 | FBLN7 | 0.688708 | 3 | 0 | 3 |
| FBP1 | CXorf21 | 0.678962 | 4 | 0 | 4 |
| FBP1 | HK3 | 0.671905 | 7 | 0 | 5 |
| FBP1 | DNMT3B | 0.669563 | 3 | 0 | 3 |
| FBP1 | ELMO3 | 0.665036 | 3 | 0 | 3 |
| FBP1 | SOHLH1 | 0.654444 | 5 | 0 | 4 |
| FBP1 | GNLY | 0.645254 | 4 | 0 | 3 |
| FBP1 | EXOSC9 | 0.642316 | 3 | 0 | 3 |
| FBP1 | SALL4 | 0.628075 | 3 | 0 | 3 |
| FBP1 | POLD1 | 0.620935 | 4 | 0 | 3 |
| FBP1 | PTGIR | 0.614325 | 3 | 0 | 3 |
| FBP1 | PCSK1N | 0.608564 | 4 | 0 | 4 |
| FBP1 | ZDHHC8 | 0.604755 | 4 | 0 | 3 |
| FBP1 | OLR1 | 0.601993 | 7 | 0 | 5 |
| FBP1 | SIRT5 | 0.601274 | 5 | 0 | 3 |
| FBP1 | SIGLEC10 | 0.59539 | 4 | 0 | 4 |
For details and further investigation, click here