| Full name: FH2 domain containing 1 | Alias Symbol: KIAA1727 | ||
| Type: protein-coding gene | Cytoband: 4q31.3 | ||
| Entrez ID: 85462 | HGNC ID: HGNC:29363 | Ensembl Gene: ENSG00000137460 | OMIM ID: |
Expression of FHDC1:
| Dataset | Gene | EntrezID | Probe | Log2FC | Adj.pValue | Expression |
|---|---|---|---|---|---|---|
| GSE17351 | FHDC1 | 85462 | 226599_at | -0.2471 | 0.7140 | |
| GSE26886 | FHDC1 | 85462 | 226599_at | -0.2930 | 0.4738 | |
| GSE45670 | FHDC1 | 85462 | 226599_at | 0.0801 | 0.6641 | |
| GSE53622 | FHDC1 | 85462 | 48905 | -0.3298 | 0.1259 | |
| GSE53624 | FHDC1 | 85462 | 48905 | -1.0123 | 0.0000 | |
| GSE63941 | FHDC1 | 85462 | 226599_at | 0.0858 | 0.8712 | |
| GSE77861 | FHDC1 | 85462 | 226599_at | -0.2164 | 0.3253 | |
| SRP007169 | FHDC1 | 85462 | RNAseq | -1.3570 | 0.0036 | |
| SRP008496 | FHDC1 | 85462 | RNAseq | -0.9924 | 0.0038 | |
| SRP064894 | FHDC1 | 85462 | RNAseq | -0.8751 | 0.0025 | |
| SRP133303 | FHDC1 | 85462 | RNAseq | -0.1994 | 0.4301 | |
| SRP159526 | FHDC1 | 85462 | RNAseq | 0.3895 | 0.3934 | |
| SRP193095 | FHDC1 | 85462 | RNAseq | 0.0841 | 0.6640 | |
| SRP219564 | FHDC1 | 85462 | RNAseq | -1.0245 | 0.1010 | |
| TCGA | FHDC1 | 85462 | RNAseq | 0.0125 | 0.9202 |
Upregulated datasets: 0; Downregulated datasets: 2.
Survival by FHDC1 expression:
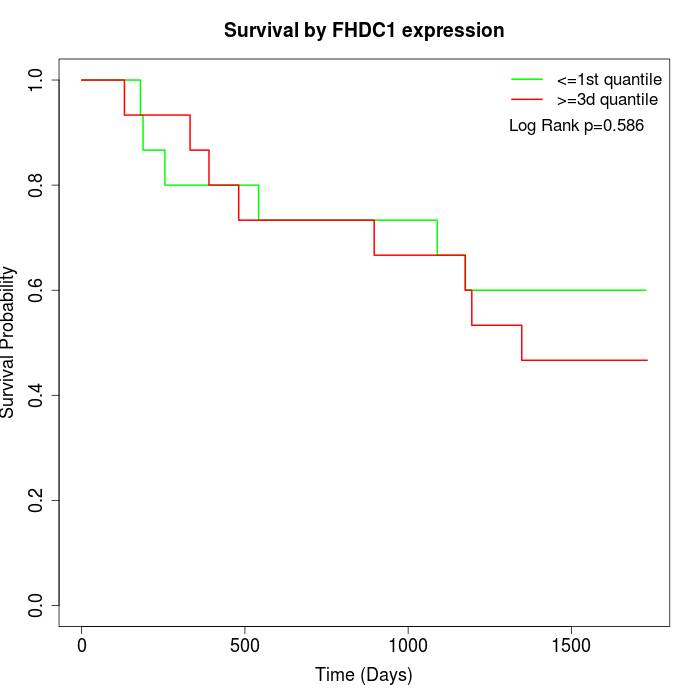 | 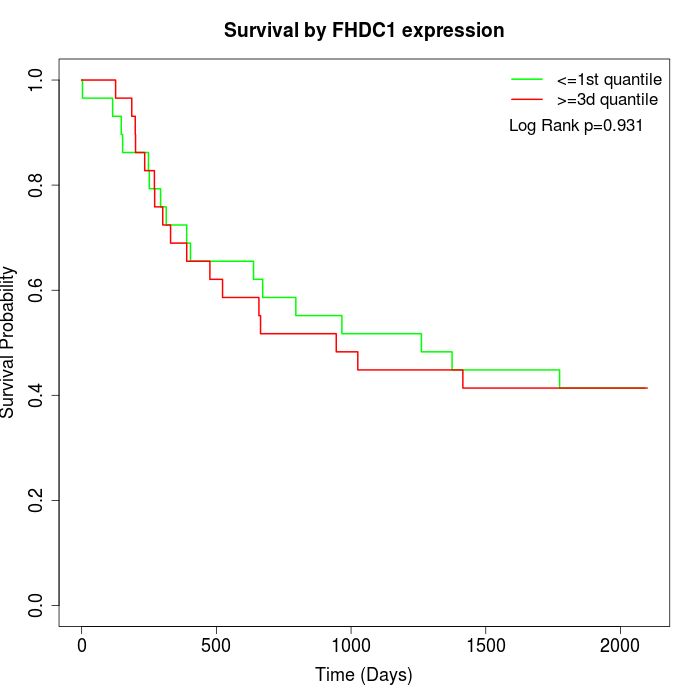 | 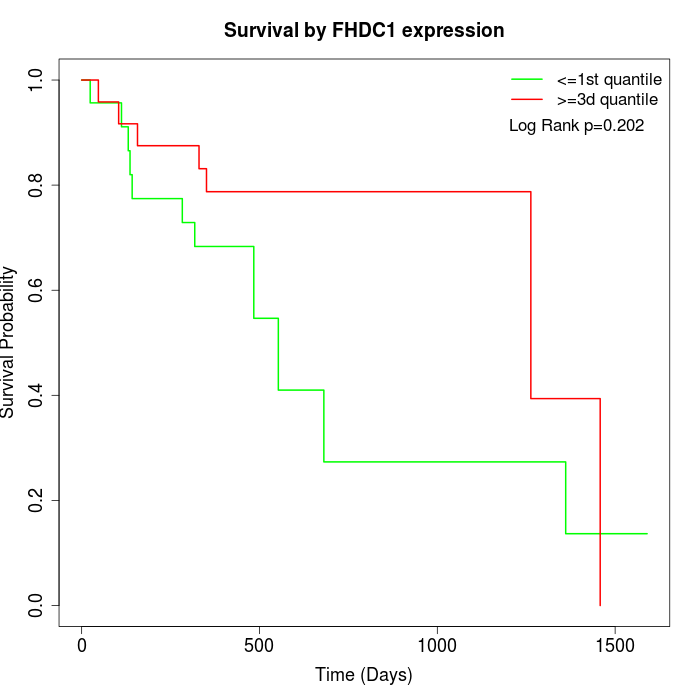 |
| GSE53622 | GSE53624 | TCGA |
Note: Click image to view full size file.
Copy number change of FHDC1:
| Dataset | Gene | EntrezID | Gain | Loss | Normal | Detail |
|---|---|---|---|---|---|---|
| GSE15526 | FHDC1 | 85462 | 0 | 14 | 16 | |
| GSE20123 | FHDC1 | 85462 | 0 | 14 | 16 | |
| GSE43470 | FHDC1 | 85462 | 0 | 13 | 30 | |
| GSE46452 | FHDC1 | 85462 | 1 | 36 | 22 | |
| GSE47630 | FHDC1 | 85462 | 0 | 23 | 17 | |
| GSE54993 | FHDC1 | 85462 | 10 | 0 | 60 | |
| GSE54994 | FHDC1 | 85462 | 1 | 13 | 39 | |
| GSE60625 | FHDC1 | 85462 | 0 | 1 | 10 | |
| GSE74703 | FHDC1 | 85462 | 0 | 11 | 25 | |
| GSE74704 | FHDC1 | 85462 | 0 | 7 | 13 | |
| TCGA | FHDC1 | 85462 | 10 | 36 | 50 |
Total number of gains: 22; Total number of losses: 168; Total Number of normals: 298.
Somatic mutations of FHDC1:
Generating mutation plots.
Highly correlated genes for FHDC1:
Showing top 20/69 corelated genes with mean PCC>0.5.
| Gene1 | Gene2 | Mean PCC | Num. Datasets | Num. PCC<0 | Num. PCC>0.5 |
|---|---|---|---|---|---|
| FHDC1 | GALNT14 | 0.687532 | 3 | 0 | 3 |
| FHDC1 | MPZL2 | 0.677891 | 3 | 0 | 3 |
| FHDC1 | SAMD9 | 0.659303 | 3 | 0 | 3 |
| FHDC1 | IL10RB | 0.649048 | 3 | 0 | 3 |
| FHDC1 | SERINC5 | 0.645779 | 4 | 0 | 4 |
| FHDC1 | DSC2 | 0.630916 | 3 | 0 | 3 |
| FHDC1 | UBAC2 | 0.624077 | 4 | 0 | 3 |
| FHDC1 | TMEM134 | 0.6222 | 3 | 0 | 3 |
| FHDC1 | ANXA2 | 0.612001 | 4 | 0 | 3 |
| FHDC1 | DSP | 0.605803 | 3 | 0 | 3 |
| FHDC1 | CMAS | 0.603072 | 3 | 0 | 3 |
| FHDC1 | MREG | 0.597344 | 4 | 0 | 3 |
| FHDC1 | TTC39A | 0.595187 | 3 | 0 | 3 |
| FHDC1 | CLCA2 | 0.586171 | 3 | 0 | 3 |
| FHDC1 | FAM160A1 | 0.58311 | 4 | 0 | 3 |
| FHDC1 | LRRC1 | 0.582501 | 4 | 0 | 3 |
| FHDC1 | CERS3 | 0.582054 | 4 | 0 | 3 |
| FHDC1 | KLK7 | 0.580469 | 3 | 0 | 3 |
| FHDC1 | MAP3K1 | 0.577401 | 4 | 0 | 3 |
| FHDC1 | TDRD3 | 0.573148 | 3 | 0 | 3 |
For details and further investigation, click here