| Full name: solute carrier family 35 member E3 | Alias Symbol: BLOV1 | ||
| Type: protein-coding gene | Cytoband: 12q15 | ||
| Entrez ID: 55508 | HGNC ID: HGNC:20864 | Ensembl Gene: ENSG00000175782 | OMIM ID: |
Expression of SLC35E3:
| Dataset | Gene | EntrezID | Probe | Log2FC | Adj.pValue | Expression |
|---|---|---|---|---|---|---|
| GSE17351 | SLC35E3 | 55508 | 218988_at | -0.1534 | 0.7850 | |
| GSE20347 | SLC35E3 | 55508 | 220396_at | 0.0506 | 0.6441 | |
| GSE23400 | SLC35E3 | 55508 | 220396_at | -0.1035 | 0.0092 | |
| GSE26886 | SLC35E3 | 55508 | 218988_at | 0.0415 | 0.8556 | |
| GSE29001 | SLC35E3 | 55508 | 218988_at | 0.4225 | 0.0809 | |
| GSE38129 | SLC35E3 | 55508 | 218988_at | 0.2563 | 0.0428 | |
| GSE45670 | SLC35E3 | 55508 | 218988_at | -0.1238 | 0.2609 | |
| GSE53622 | SLC35E3 | 55508 | 90582 | 0.0879 | 0.2567 | |
| GSE53624 | SLC35E3 | 55508 | 90582 | 0.1806 | 0.0033 | |
| GSE63941 | SLC35E3 | 55508 | 218988_at | -0.1866 | 0.8218 | |
| GSE77861 | SLC35E3 | 55508 | 218988_at | 0.1965 | 0.3555 | |
| GSE97050 | SLC35E3 | 55508 | A_23_P147729 | 0.0577 | 0.8251 | |
| SRP007169 | SLC35E3 | 55508 | RNAseq | 0.2750 | 0.4949 | |
| SRP008496 | SLC35E3 | 55508 | RNAseq | 0.3569 | 0.2392 | |
| SRP064894 | SLC35E3 | 55508 | RNAseq | 0.2106 | 0.3195 | |
| SRP133303 | SLC35E3 | 55508 | RNAseq | 0.5013 | 0.0493 | |
| SRP159526 | SLC35E3 | 55508 | RNAseq | 0.5184 | 0.0157 | |
| SRP193095 | SLC35E3 | 55508 | RNAseq | 0.0251 | 0.8100 | |
| SRP219564 | SLC35E3 | 55508 | RNAseq | 0.7447 | 0.2268 | |
| TCGA | SLC35E3 | 55508 | RNAseq | 0.1213 | 0.1655 |
Upregulated datasets: 0; Downregulated datasets: 0.
Survival by SLC35E3 expression:
 | 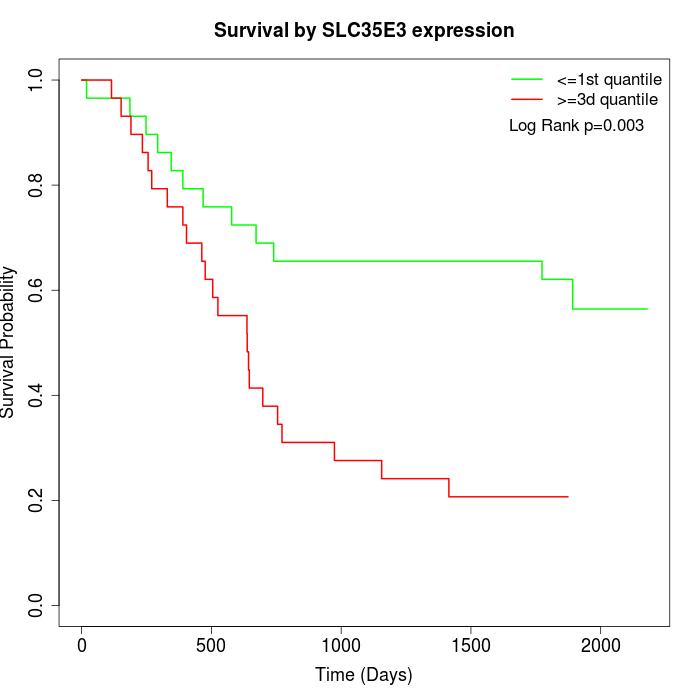 | 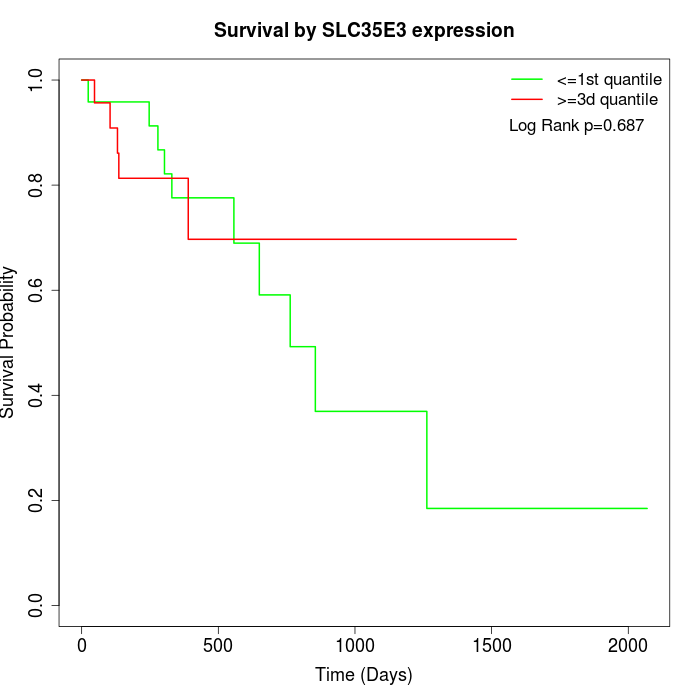 |
| GSE53622 | GSE53624 | TCGA |
Note: Click image to view full size file.
Copy number change of SLC35E3:
| Dataset | Gene | EntrezID | Gain | Loss | Normal | Detail |
|---|---|---|---|---|---|---|
| GSE15526 | SLC35E3 | 55508 | 6 | 1 | 23 | |
| GSE20123 | SLC35E3 | 55508 | 6 | 0 | 24 | |
| GSE43470 | SLC35E3 | 55508 | 5 | 0 | 38 | |
| GSE46452 | SLC35E3 | 55508 | 12 | 0 | 47 | |
| GSE47630 | SLC35E3 | 55508 | 10 | 1 | 29 | |
| GSE54993 | SLC35E3 | 55508 | 0 | 7 | 63 | |
| GSE54994 | SLC35E3 | 55508 | 7 | 1 | 45 | |
| GSE60625 | SLC35E3 | 55508 | 0 | 0 | 11 | |
| GSE74703 | SLC35E3 | 55508 | 5 | 0 | 31 | |
| GSE74704 | SLC35E3 | 55508 | 5 | 0 | 15 | |
| TCGA | SLC35E3 | 55508 | 23 | 8 | 65 |
Total number of gains: 79; Total number of losses: 18; Total Number of normals: 391.
Somatic mutations of SLC35E3:
Generating mutation plots.
Highly correlated genes for SLC35E3:
Showing top 20/162 corelated genes with mean PCC>0.5.
| Gene1 | Gene2 | Mean PCC | Num. Datasets | Num. PCC<0 | Num. PCC>0.5 |
|---|---|---|---|---|---|
| SLC35E3 | ADAM9 | 0.845016 | 3 | 0 | 3 |
| SLC35E3 | ABI1 | 0.817685 | 3 | 0 | 3 |
| SLC35E3 | PRPS1L1 | 0.782356 | 3 | 0 | 3 |
| SLC35E3 | RAB21 | 0.779375 | 4 | 0 | 4 |
| SLC35E3 | RBAK | 0.765128 | 3 | 0 | 3 |
| SLC35E3 | PTCD2 | 0.752005 | 3 | 0 | 3 |
| SLC35E3 | TBCK | 0.741274 | 3 | 0 | 3 |
| SLC35E3 | FNIP1 | 0.7363 | 3 | 0 | 3 |
| SLC35E3 | TNFRSF8 | 0.725991 | 3 | 0 | 3 |
| SLC35E3 | FAM126A | 0.723895 | 3 | 0 | 3 |
| SLC35E3 | TM2D2 | 0.722924 | 3 | 0 | 3 |
| SLC35E3 | RNF183 | 0.722129 | 3 | 0 | 3 |
| SLC35E3 | NEK11 | 0.720348 | 4 | 0 | 4 |
| SLC35E3 | KCND3 | 0.718851 | 3 | 0 | 3 |
| SLC35E3 | CCDC7 | 0.710618 | 4 | 0 | 3 |
| SLC35E3 | OSBPL8 | 0.702096 | 3 | 0 | 3 |
| SLC35E3 | ESR2 | 0.691025 | 3 | 0 | 3 |
| SLC35E3 | ZNF121 | 0.684499 | 3 | 0 | 3 |
| SLC35E3 | YIPF4 | 0.683193 | 4 | 0 | 3 |
| SLC35E3 | VSNL1 | 0.68255 | 3 | 0 | 3 |
For details and further investigation, click here