| Full name: FRAS1 related extracellular matrix 1 | Alias Symbol: FLJ25461|C9orf145|C9orf143|DKFZp686M16108|TILRR | ||
| Type: protein-coding gene | Cytoband: 9p22.3 | ||
| Entrez ID: 158326 | HGNC ID: HGNC:23399 | Ensembl Gene: ENSG00000164946 | OMIM ID: 608944 |
Expression of FREM1:
| Dataset | Gene | EntrezID | Probe | Log2FC | Adj.pValue | Expression |
|---|---|---|---|---|---|---|
| GSE17351 | FREM1 | 158326 | 228233_at | -0.1394 | 0.6846 | |
| GSE26886 | FREM1 | 158326 | 228233_at | 0.1915 | 0.0752 | |
| GSE45670 | FREM1 | 158326 | 228233_at | -0.0897 | 0.5840 | |
| GSE53622 | FREM1 | 158326 | 75587 | -0.5581 | 0.0000 | |
| GSE53624 | FREM1 | 158326 | 75587 | -0.3471 | 0.0011 | |
| GSE63941 | FREM1 | 158326 | 228233_at | 0.1379 | 0.4573 | |
| GSE77861 | FREM1 | 158326 | 228233_at | 0.0278 | 0.8113 | |
| GSE97050 | FREM1 | 158326 | A_23_P43337 | -0.1785 | 0.7494 | |
| SRP064894 | FREM1 | 158326 | RNAseq | -0.0360 | 0.9429 | |
| SRP133303 | FREM1 | 158326 | RNAseq | -1.1365 | 0.0133 | |
| SRP159526 | FREM1 | 158326 | RNAseq | 0.2747 | 0.5690 | |
| SRP219564 | FREM1 | 158326 | RNAseq | 0.8718 | 0.3908 | |
| TCGA | FREM1 | 158326 | RNAseq | -1.1325 | 0.0217 |
Upregulated datasets: 0; Downregulated datasets: 2.
Survival by FREM1 expression:
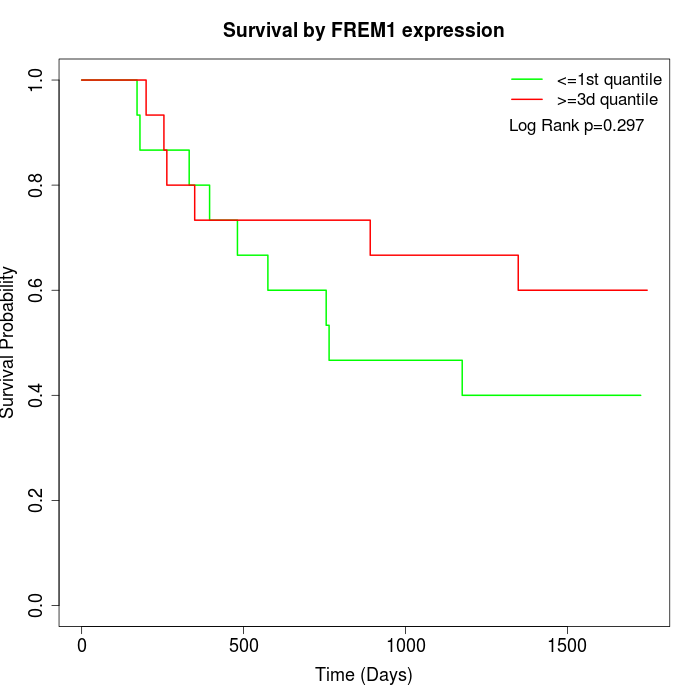 | 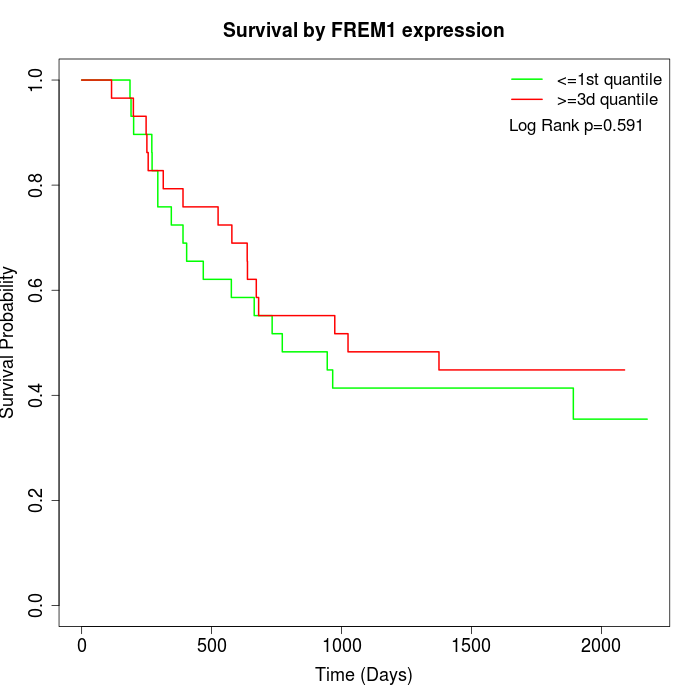 | 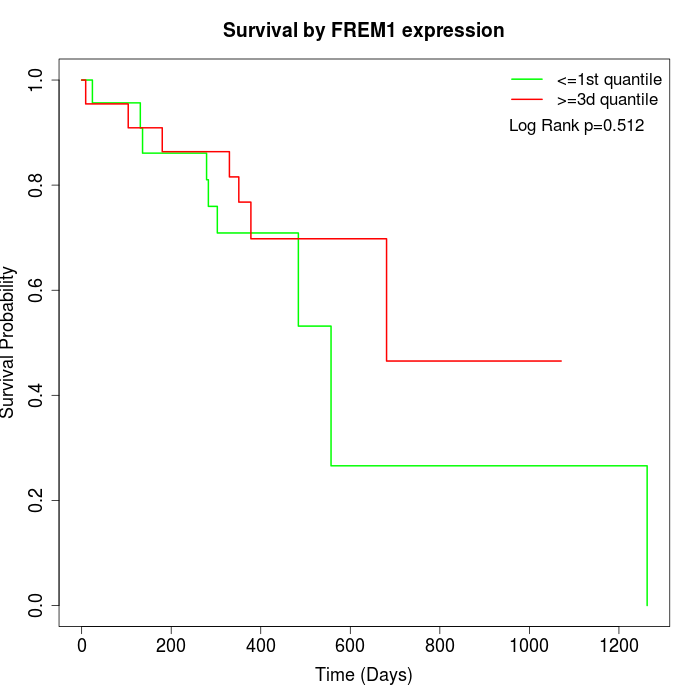 |
| GSE53622 | GSE53624 | TCGA |
Note: Click image to view full size file.
Copy number change of FREM1:
| Dataset | Gene | EntrezID | Gain | Loss | Normal | Detail |
|---|---|---|---|---|---|---|
| GSE15526 | FREM1 | 158326 | 2 | 16 | 12 | |
| GSE20123 | FREM1 | 158326 | 2 | 16 | 12 | |
| GSE43470 | FREM1 | 158326 | 5 | 11 | 27 | |
| GSE46452 | FREM1 | 158326 | 2 | 23 | 34 | |
| GSE47630 | FREM1 | 158326 | 4 | 26 | 10 | |
| GSE54993 | FREM1 | 158326 | 6 | 3 | 61 | |
| GSE54994 | FREM1 | 158326 | 10 | 16 | 27 | |
| GSE60625 | FREM1 | 158326 | 0 | 0 | 11 | |
| GSE74703 | FREM1 | 158326 | 5 | 8 | 23 | |
| GSE74704 | FREM1 | 158326 | 0 | 13 | 7 | |
| TCGA | FREM1 | 158326 | 14 | 50 | 32 |
Total number of gains: 50; Total number of losses: 182; Total Number of normals: 256.
Somatic mutations of FREM1:
Generating mutation plots.
Highly correlated genes for FREM1:
Showing all 20 correlated genes with mean PCC>0.5.
| Gene1 | Gene2 | Mean PCC | Num. Datasets | Num. PCC<0 | Num. PCC>0.5 |
|---|---|---|---|---|---|
| FREM1 | ALDH8A1 | 0.698091 | 3 | 0 | 3 |
| FREM1 | PRKCB | 0.678586 | 3 | 0 | 3 |
| FREM1 | TBX21 | 0.666638 | 3 | 0 | 3 |
| FREM1 | FRMD1 | 0.653654 | 3 | 0 | 3 |
| FREM1 | SLC27A5 | 0.648417 | 3 | 0 | 3 |
| FREM1 | HECW1 | 0.637114 | 3 | 0 | 3 |
| FREM1 | CHRND | 0.613322 | 4 | 0 | 3 |
| FREM1 | NEURL2 | 0.60878 | 3 | 0 | 3 |
| FREM1 | GKAP1 | 0.59946 | 4 | 0 | 3 |
| FREM1 | OPRD1 | 0.583769 | 4 | 0 | 3 |
| FREM1 | CDH26 | 0.583512 | 4 | 0 | 3 |
| FREM1 | MEF2C | 0.570097 | 4 | 0 | 3 |
| FREM1 | MGP | 0.566751 | 4 | 0 | 3 |
| FREM1 | ZNF135 | 0.560178 | 3 | 0 | 3 |
| FREM1 | C19orf73 | 0.554719 | 4 | 0 | 3 |
| FREM1 | PRUNE2 | 0.536455 | 3 | 0 | 3 |
| FREM1 | APOL4 | 0.527503 | 4 | 0 | 3 |
| FREM1 | MYH11 | 0.519783 | 4 | 0 | 3 |
| FREM1 | MAPK4 | 0.514898 | 4 | 0 | 3 |
| FREM1 | DACH1 | 0.501462 | 9 | 0 | 5 |
For details and further investigation, click here