| Full name: GTPase activating protein and VPS9 domains 1 | Alias Symbol: DKFZP434C212|KIAA1521 | ||
| Type: protein-coding gene | Cytoband: 9q33.3 | ||
| Entrez ID: 26130 | HGNC ID: HGNC:23375 | Ensembl Gene: ENSG00000165219 | OMIM ID: 611714 |
Expression of GAPVD1:
| Dataset | Gene | EntrezID | Probe | Log2FC | Adj.pValue | Expression |
|---|---|---|---|---|---|---|
| GSE17351 | GAPVD1 | 26130 | 212802_s_at | -0.4672 | 0.0885 | |
| GSE20347 | GAPVD1 | 26130 | 212802_s_at | -0.8600 | 0.0000 | |
| GSE23400 | GAPVD1 | 26130 | 212802_s_at | -0.3788 | 0.0000 | |
| GSE26886 | GAPVD1 | 26130 | 212802_s_at | -0.2202 | 0.3584 | |
| GSE29001 | GAPVD1 | 26130 | 212802_s_at | -0.7550 | 0.0051 | |
| GSE38129 | GAPVD1 | 26130 | 212802_s_at | -0.6129 | 0.0000 | |
| GSE45670 | GAPVD1 | 26130 | 212802_s_at | -0.3936 | 0.0037 | |
| GSE53622 | GAPVD1 | 26130 | 29568 | -0.3696 | 0.0000 | |
| GSE53624 | GAPVD1 | 26130 | 29568 | -0.3486 | 0.0000 | |
| GSE63941 | GAPVD1 | 26130 | 212802_s_at | 0.3820 | 0.2924 | |
| GSE77861 | GAPVD1 | 26130 | 212802_s_at | -0.3736 | 0.0840 | |
| GSE97050 | GAPVD1 | 26130 | A_32_P228414 | -0.5423 | 0.1663 | |
| SRP007169 | GAPVD1 | 26130 | RNAseq | -0.6826 | 0.0552 | |
| SRP008496 | GAPVD1 | 26130 | RNAseq | -0.6523 | 0.0003 | |
| SRP064894 | GAPVD1 | 26130 | RNAseq | -0.5842 | 0.0012 | |
| SRP133303 | GAPVD1 | 26130 | RNAseq | -0.1773 | 0.1938 | |
| SRP159526 | GAPVD1 | 26130 | RNAseq | -0.5054 | 0.0047 | |
| SRP193095 | GAPVD1 | 26130 | RNAseq | -0.4279 | 0.0000 | |
| SRP219564 | GAPVD1 | 26130 | RNAseq | -0.6989 | 0.0326 | |
| TCGA | GAPVD1 | 26130 | RNAseq | -0.0172 | 0.7230 |
Upregulated datasets: 0; Downregulated datasets: 0.
Survival by GAPVD1 expression:
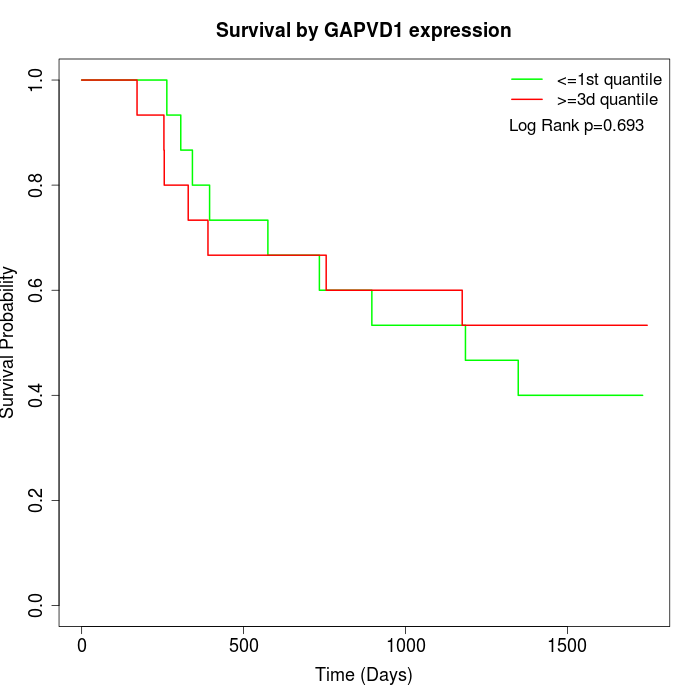 | 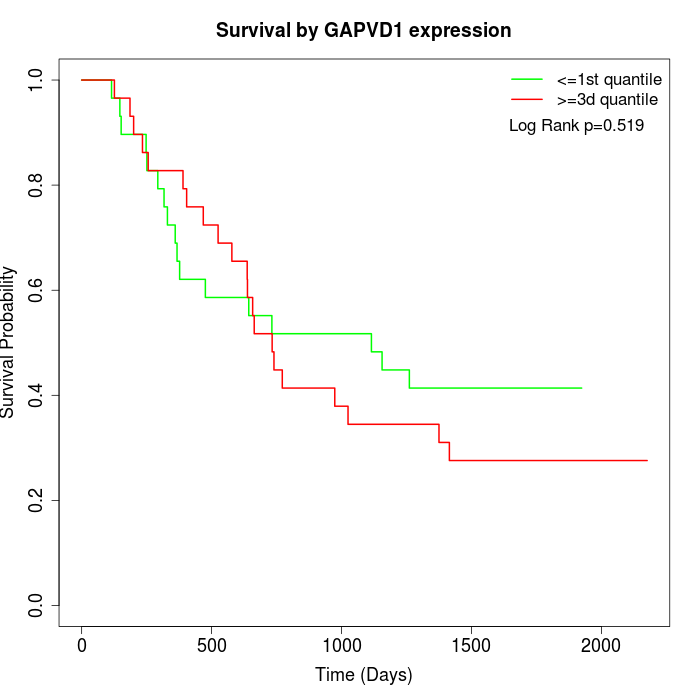 | 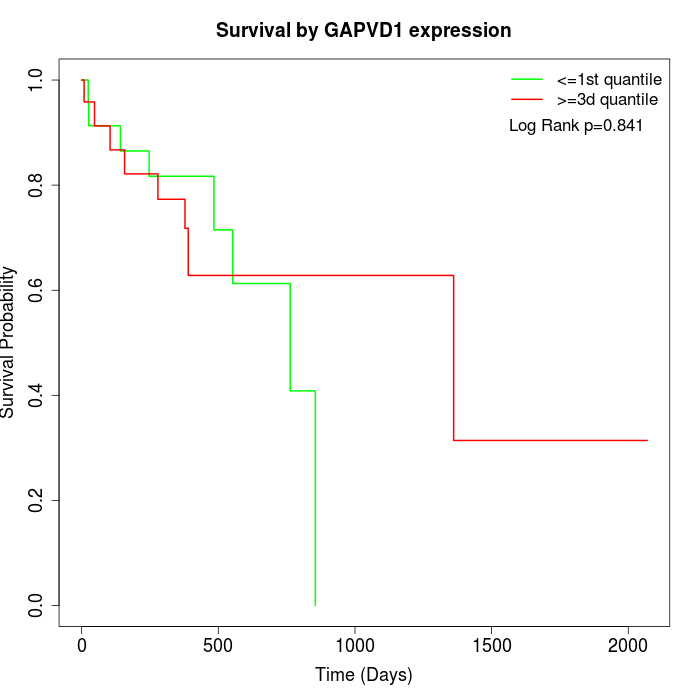 |
| GSE53622 | GSE53624 | TCGA |
Note: Click image to view full size file.
Copy number change of GAPVD1:
| Dataset | Gene | EntrezID | Gain | Loss | Normal | Detail |
|---|---|---|---|---|---|---|
| GSE15526 | GAPVD1 | 26130 | 4 | 8 | 18 | |
| GSE20123 | GAPVD1 | 26130 | 4 | 8 | 18 | |
| GSE43470 | GAPVD1 | 26130 | 5 | 5 | 33 | |
| GSE46452 | GAPVD1 | 26130 | 6 | 13 | 40 | |
| GSE47630 | GAPVD1 | 26130 | 3 | 16 | 21 | |
| GSE54993 | GAPVD1 | 26130 | 3 | 3 | 64 | |
| GSE54994 | GAPVD1 | 26130 | 12 | 8 | 33 | |
| GSE60625 | GAPVD1 | 26130 | 0 | 0 | 11 | |
| GSE74703 | GAPVD1 | 26130 | 5 | 3 | 28 | |
| GSE74704 | GAPVD1 | 26130 | 2 | 6 | 12 | |
| TCGA | GAPVD1 | 26130 | 27 | 25 | 44 |
Total number of gains: 71; Total number of losses: 95; Total Number of normals: 322.
Somatic mutations of GAPVD1:
Generating mutation plots.
Highly correlated genes for GAPVD1:
Showing top 20/1419 corelated genes with mean PCC>0.5.
| Gene1 | Gene2 | Mean PCC | Num. Datasets | Num. PCC<0 | Num. PCC>0.5 |
|---|---|---|---|---|---|
| GAPVD1 | SNX14 | 0.767022 | 4 | 0 | 4 |
| GAPVD1 | UTY | 0.766294 | 3 | 0 | 3 |
| GAPVD1 | SLC10A7 | 0.765189 | 3 | 0 | 3 |
| GAPVD1 | RNFT1 | 0.758763 | 3 | 0 | 3 |
| GAPVD1 | YPEL2 | 0.75826 | 3 | 0 | 3 |
| GAPVD1 | CGNL1 | 0.755995 | 4 | 0 | 4 |
| GAPVD1 | SPAG17 | 0.74568 | 3 | 0 | 3 |
| GAPVD1 | RBX1 | 0.740702 | 3 | 0 | 3 |
| GAPVD1 | ZYG11B | 0.738308 | 3 | 0 | 3 |
| GAPVD1 | COG6 | 0.730391 | 3 | 0 | 3 |
| GAPVD1 | PARP4 | 0.724227 | 6 | 0 | 5 |
| GAPVD1 | LMBRD2 | 0.722924 | 3 | 0 | 3 |
| GAPVD1 | ITGA2 | 0.722745 | 3 | 0 | 3 |
| GAPVD1 | SCAF8 | 0.72199 | 3 | 0 | 3 |
| GAPVD1 | CYSRT1 | 0.719952 | 5 | 0 | 4 |
| GAPVD1 | TSPAN31 | 0.718632 | 3 | 0 | 3 |
| GAPVD1 | LDHD | 0.716847 | 4 | 0 | 3 |
| GAPVD1 | NMNAT1 | 0.71295 | 3 | 0 | 3 |
| GAPVD1 | STXBP5 | 0.711133 | 6 | 0 | 6 |
| GAPVD1 | MRPS36 | 0.710288 | 6 | 0 | 6 |
For details and further investigation, click here