| Full name: growth arrest specific 2 | Alias Symbol: | ||
| Type: protein-coding gene | Cytoband: 11p14.3 | ||
| Entrez ID: 2620 | HGNC ID: HGNC:4167 | Ensembl Gene: ENSG00000148935 | OMIM ID: 602835 |
Expression of GAS2:
| Dataset | Gene | EntrezID | Probe | Log2FC | Adj.pValue | Expression |
|---|---|---|---|---|---|---|
| GSE17351 | GAS2 | 2620 | 205848_at | -0.3509 | 0.2729 | |
| GSE20347 | GAS2 | 2620 | 205848_at | -0.3168 | 0.0000 | |
| GSE23400 | GAS2 | 2620 | 205848_at | -0.1507 | 0.0000 | |
| GSE26886 | GAS2 | 2620 | 205848_at | -0.1773 | 0.0570 | |
| GSE29001 | GAS2 | 2620 | 205848_at | -0.1731 | 0.6429 | |
| GSE38129 | GAS2 | 2620 | 205848_at | -0.3567 | 0.0971 | |
| GSE45670 | GAS2 | 2620 | 205848_at | -0.2256 | 0.6754 | |
| GSE53622 | GAS2 | 2620 | 43715 | -0.9845 | 0.0000 | |
| GSE53624 | GAS2 | 2620 | 53182 | -0.5950 | 0.0015 | |
| GSE63941 | GAS2 | 2620 | 205848_at | -0.1198 | 0.8679 | |
| GSE77861 | GAS2 | 2620 | 205848_at | -0.0743 | 0.5237 | |
| SRP133303 | GAS2 | 2620 | RNAseq | -1.3160 | 0.0001 | |
| SRP159526 | GAS2 | 2620 | RNAseq | -0.5453 | 0.5589 | |
| TCGA | GAS2 | 2620 | RNAseq | -2.3323 | 0.0001 |
Upregulated datasets: 0; Downregulated datasets: 2.
Survival by GAS2 expression:
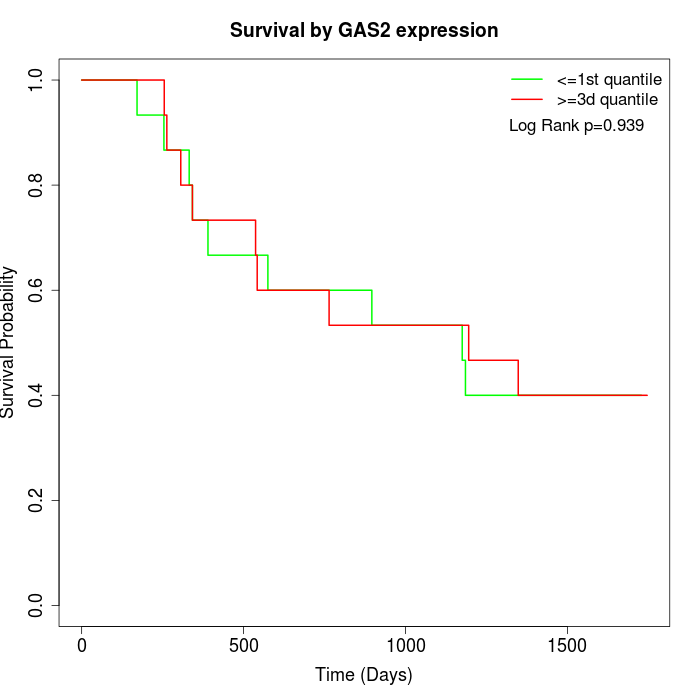 | 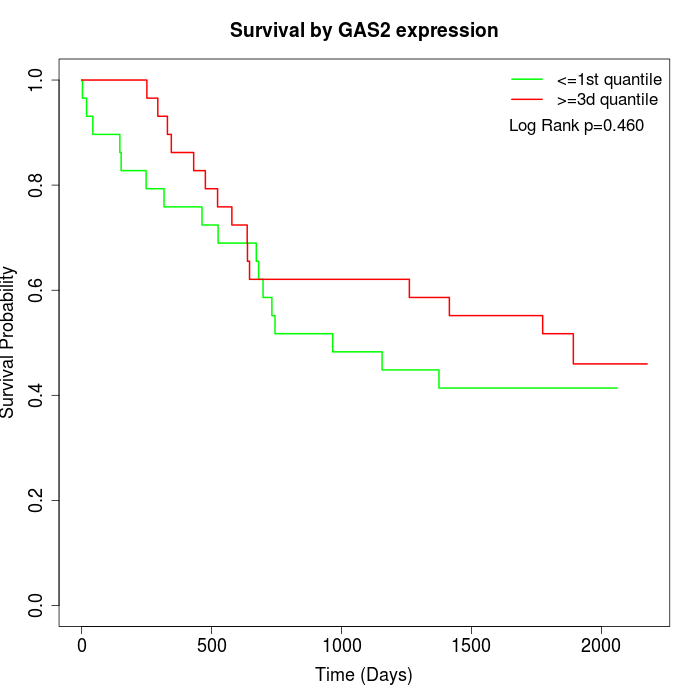 | 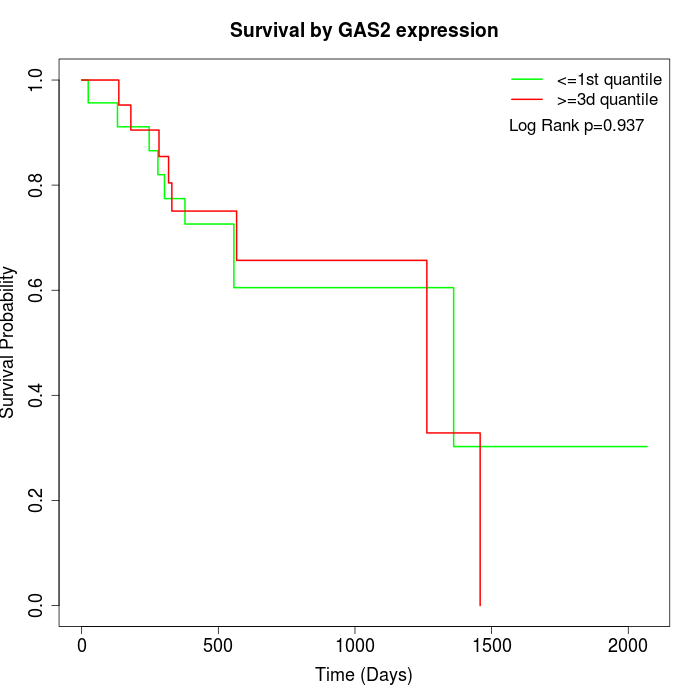 |
| GSE53622 | GSE53624 | TCGA |
Note: Click image to view full size file.
Copy number change of GAS2:
| Dataset | Gene | EntrezID | Gain | Loss | Normal | Detail |
|---|---|---|---|---|---|---|
| GSE15526 | GAS2 | 2620 | 0 | 11 | 19 | |
| GSE20123 | GAS2 | 2620 | 0 | 11 | 19 | |
| GSE43470 | GAS2 | 2620 | 1 | 6 | 36 | |
| GSE46452 | GAS2 | 2620 | 7 | 5 | 47 | |
| GSE47630 | GAS2 | 2620 | 3 | 10 | 27 | |
| GSE54993 | GAS2 | 2620 | 3 | 0 | 67 | |
| GSE54994 | GAS2 | 2620 | 3 | 12 | 38 | |
| GSE60625 | GAS2 | 2620 | 0 | 0 | 11 | |
| GSE74703 | GAS2 | 2620 | 1 | 4 | 31 | |
| GSE74704 | GAS2 | 2620 | 0 | 9 | 11 | |
| TCGA | GAS2 | 2620 | 12 | 25 | 59 |
Total number of gains: 30; Total number of losses: 93; Total Number of normals: 365.
Somatic mutations of GAS2:
Generating mutation plots.
Highly correlated genes for GAS2:
Showing top 20/158 corelated genes with mean PCC>0.5.
| Gene1 | Gene2 | Mean PCC | Num. Datasets | Num. PCC<0 | Num. PCC>0.5 |
|---|---|---|---|---|---|
| GAS2 | SBSPON | 0.702709 | 3 | 0 | 3 |
| GAS2 | SEMA4A | 0.660985 | 3 | 0 | 3 |
| GAS2 | FOSL2 | 0.645452 | 3 | 0 | 3 |
| GAS2 | KRT32 | 0.635554 | 4 | 0 | 4 |
| GAS2 | CRISP3 | 0.628173 | 6 | 0 | 4 |
| GAS2 | GYS2 | 0.627203 | 4 | 0 | 4 |
| GAS2 | TMEM232 | 0.620061 | 4 | 0 | 3 |
| GAS2 | CRISP2 | 0.617827 | 5 | 0 | 3 |
| GAS2 | NR3C2 | 0.61704 | 6 | 0 | 5 |
| GAS2 | RGS11 | 0.616217 | 4 | 0 | 4 |
| GAS2 | GSG1 | 0.61226 | 4 | 0 | 3 |
| GAS2 | NRG2 | 0.602916 | 4 | 0 | 3 |
| GAS2 | CHKB | 0.602478 | 5 | 0 | 4 |
| GAS2 | PDE6A | 0.602316 | 5 | 0 | 3 |
| GAS2 | PADI1 | 0.602227 | 5 | 0 | 5 |
| GAS2 | CRAT | 0.599567 | 4 | 0 | 3 |
| GAS2 | CD99 | 0.596273 | 3 | 0 | 3 |
| GAS2 | HOPX | 0.59212 | 5 | 0 | 4 |
| GAS2 | ECM1 | 0.591812 | 4 | 0 | 3 |
| GAS2 | DBNDD1 | 0.589733 | 5 | 0 | 5 |
For details and further investigation, click here