| Full name: guanylate binding protein 3 | Alias Symbol: FLJ10961 | ||
| Type: protein-coding gene | Cytoband: 1p22.2 | ||
| Entrez ID: 2635 | HGNC ID: HGNC:4184 | Ensembl Gene: ENSG00000117226 | OMIM ID: 600413 |
Expression of GBP3:
| Dataset | Gene | EntrezID | Probe | Log2FC | Adj.pValue | Expression |
|---|---|---|---|---|---|---|
| GSE17351 | GBP3 | 2635 | 223434_at | -0.0625 | 0.9444 | |
| GSE26886 | GBP3 | 2635 | 223434_at | 0.1393 | 0.8695 | |
| GSE45670 | GBP3 | 2635 | 223434_at | 0.0969 | 0.8512 | |
| GSE53622 | GBP3 | 2635 | 35067 | 0.1655 | 0.4489 | |
| GSE53624 | GBP3 | 2635 | 35067 | 0.0512 | 0.7486 | |
| GSE63941 | GBP3 | 2635 | 223434_at | -3.0067 | 0.1256 | |
| GSE77861 | GBP3 | 2635 | 223434_at | -1.3230 | 0.0187 | |
| GSE97050 | GBP3 | A_21_P0010536 | 0.5442 | 0.3803 | ||
| SRP007169 | GBP3 | 2635 | RNAseq | 0.8093 | 0.3574 | |
| SRP008496 | GBP3 | 2635 | RNAseq | 0.6338 | 0.2634 | |
| SRP064894 | GBP3 | 2635 | RNAseq | 0.5303 | 0.0034 | |
| SRP133303 | GBP3 | 2635 | RNAseq | 0.2353 | 0.4657 | |
| SRP159526 | GBP3 | 2635 | RNAseq | -0.5498 | 0.3366 | |
| SRP193095 | GBP3 | 2635 | RNAseq | 0.0417 | 0.8802 | |
| TCGA | GBP3 | 2635 | RNAseq | 0.0893 | 0.5211 |
Upregulated datasets: 0; Downregulated datasets: 1.
Survival by GBP3 expression:
 | 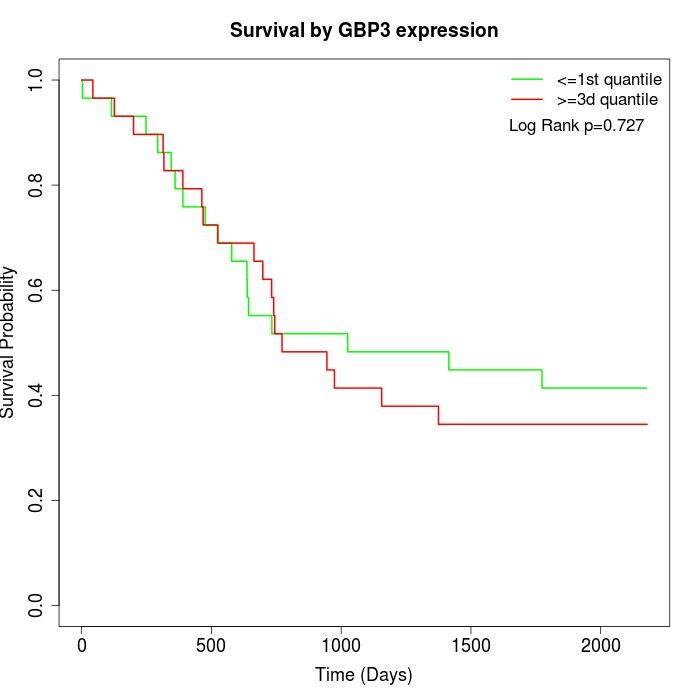 | 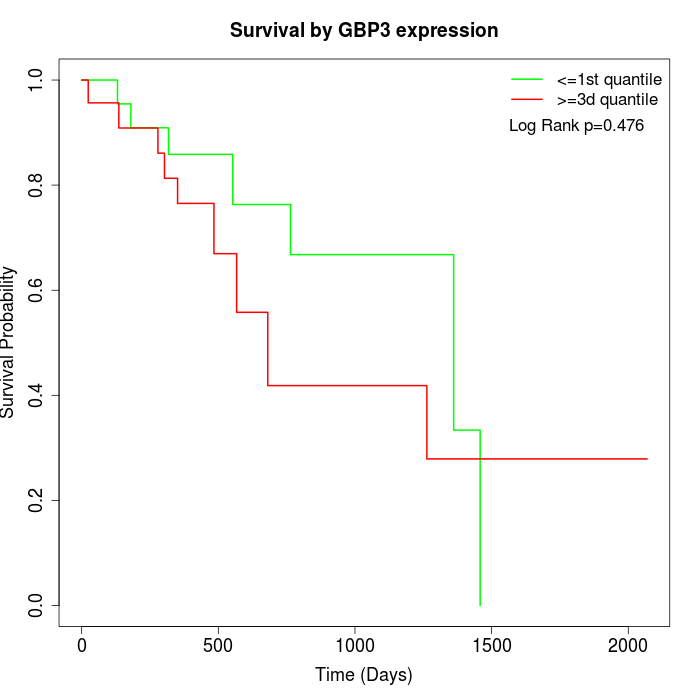 |
| GSE53622 | GSE53624 | TCGA |
Note: Click image to view full size file.
Copy number change of GBP3:
| Dataset | Gene | EntrezID | Gain | Loss | Normal | Detail |
|---|---|---|---|---|---|---|
| GSE15526 | GBP3 | 2635 | 0 | 8 | 22 | |
| GSE20123 | GBP3 | 2635 | 0 | 8 | 22 | |
| GSE43470 | GBP3 | 2635 | 2 | 4 | 37 | |
| GSE46452 | GBP3 | 2635 | 1 | 1 | 57 | |
| GSE47630 | GBP3 | 2635 | 8 | 5 | 27 | |
| GSE54993 | GBP3 | 2635 | 0 | 1 | 69 | |
| GSE54994 | GBP3 | 2635 | 6 | 2 | 45 | |
| GSE60625 | GBP3 | 2635 | 0 | 0 | 11 | |
| GSE74703 | GBP3 | 2635 | 1 | 3 | 32 | |
| GSE74704 | GBP3 | 2635 | 0 | 5 | 15 | |
| TCGA | GBP3 | 2635 | 6 | 23 | 67 |
Total number of gains: 24; Total number of losses: 60; Total Number of normals: 404.
Somatic mutations of GBP3:
Generating mutation plots.
Highly correlated genes for GBP3:
Showing top 20/35 corelated genes with mean PCC>0.5.
| Gene1 | Gene2 | Mean PCC | Num. Datasets | Num. PCC<0 | Num. PCC>0.5 |
|---|---|---|---|---|---|
| GBP3 | CFB | 0.658424 | 4 | 0 | 4 |
| GBP3 | OGFOD3 | 0.639781 | 3 | 0 | 3 |
| GBP3 | GBP2 | 0.635644 | 5 | 0 | 4 |
| GBP3 | ELK3 | 0.61818 | 4 | 0 | 3 |
| GBP3 | RALGPS2 | 0.61417 | 3 | 0 | 3 |
| GBP3 | GNA15 | 0.612204 | 3 | 0 | 3 |
| GBP3 | TRIM5 | 0.610846 | 7 | 0 | 5 |
| GBP3 | BTN3A3 | 0.601744 | 4 | 0 | 3 |
| GBP3 | TRIM22 | 0.587879 | 7 | 0 | 5 |
| GBP3 | PAQR7 | 0.581424 | 3 | 0 | 3 |
| GBP3 | IFIT3 | 0.57689 | 7 | 0 | 5 |
| GBP3 | VDR | 0.57375 | 6 | 0 | 4 |
| GBP3 | SAMD9L | 0.569263 | 7 | 0 | 4 |
| GBP3 | CAPG | 0.561055 | 4 | 0 | 3 |
| GBP3 | IFIH1 | 0.558222 | 5 | 0 | 4 |
| GBP3 | TRIM6 | 0.55449 | 5 | 0 | 3 |
| GBP3 | TMEM51 | 0.550896 | 6 | 0 | 4 |
| GBP3 | MVP | 0.549989 | 6 | 0 | 3 |
| GBP3 | YIPF5 | 0.547394 | 6 | 0 | 4 |
| GBP3 | NCKAP5 | 0.543809 | 4 | 0 | 3 |
For details and further investigation, click here