| Full name: guanylate binding protein 4 | Alias Symbol: Mpa2 | ||
| Type: protein-coding gene | Cytoband: 1p22.2 | ||
| Entrez ID: 115361 | HGNC ID: HGNC:20480 | Ensembl Gene: ENSG00000162654 | OMIM ID: 612466 |
Expression of GBP4:
| Dataset | Gene | EntrezID | Probe | Log2FC | Adj.pValue | Expression |
|---|---|---|---|---|---|---|
| GSE17351 | GBP4 | 115361 | 235175_at | -0.1005 | 0.9396 | |
| GSE26886 | GBP4 | 115361 | 235175_at | -0.1863 | 0.6494 | |
| GSE45670 | GBP4 | 115361 | 235175_at | 0.1135 | 0.7804 | |
| GSE53622 | GBP4 | 115361 | 7577 | 0.2443 | 0.0962 | |
| GSE53624 | GBP4 | 115361 | 7577 | 0.1139 | 0.3167 | |
| GSE63941 | GBP4 | 115361 | 235574_at | 0.3459 | 0.6715 | |
| GSE77861 | GBP4 | 115361 | 235175_at | -0.1939 | 0.1156 | |
| GSE97050 | GBP4 | 115361 | A_24_P45446 | 0.3767 | 0.4258 | |
| SRP007169 | GBP4 | 115361 | RNAseq | -1.1478 | 0.0242 | |
| SRP008496 | GBP4 | 115361 | RNAseq | -1.1740 | 0.0009 | |
| SRP064894 | GBP4 | 115361 | RNAseq | 0.0512 | 0.8173 | |
| SRP133303 | GBP4 | 115361 | RNAseq | 0.2809 | 0.3087 | |
| SRP193095 | GBP4 | 115361 | RNAseq | 0.1407 | 0.3592 | |
| SRP219564 | GBP4 | 115361 | RNAseq | 1.2753 | 0.0653 | |
| TCGA | GBP4 | 115361 | RNAseq | 0.1667 | 0.2855 |
Upregulated datasets: 0; Downregulated datasets: 2.
Survival by GBP4 expression:
 |  | 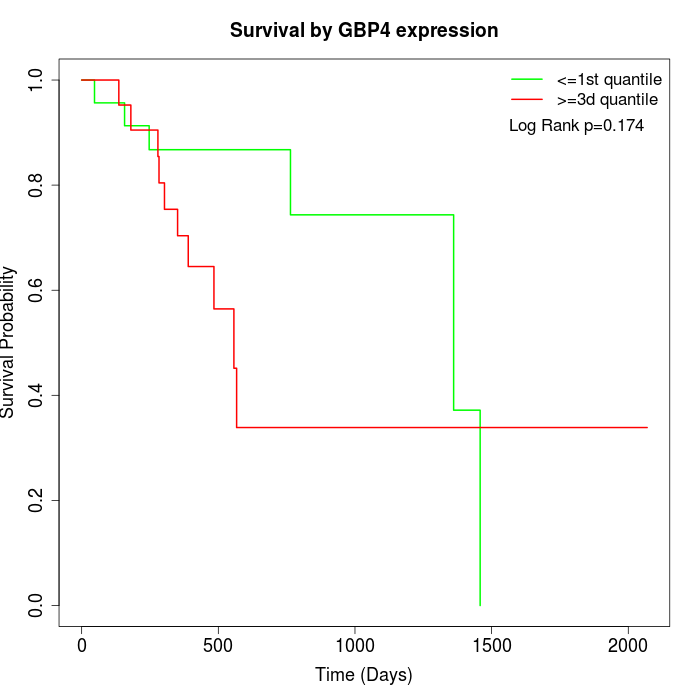 |
| GSE53622 | GSE53624 | TCGA |
Note: Click image to view full size file.
Copy number change of GBP4:
| Dataset | Gene | EntrezID | Gain | Loss | Normal | Detail |
|---|---|---|---|---|---|---|
| GSE15526 | GBP4 | 115361 | 0 | 8 | 22 | |
| GSE20123 | GBP4 | 115361 | 0 | 8 | 22 | |
| GSE43470 | GBP4 | 115361 | 2 | 4 | 37 | |
| GSE46452 | GBP4 | 115361 | 1 | 1 | 57 | |
| GSE47630 | GBP4 | 115361 | 8 | 5 | 27 | |
| GSE54993 | GBP4 | 115361 | 0 | 1 | 69 | |
| GSE54994 | GBP4 | 115361 | 6 | 2 | 45 | |
| GSE60625 | GBP4 | 115361 | 0 | 0 | 11 | |
| GSE74703 | GBP4 | 115361 | 1 | 3 | 32 | |
| GSE74704 | GBP4 | 115361 | 0 | 5 | 15 | |
| TCGA | GBP4 | 115361 | 6 | 23 | 67 |
Total number of gains: 24; Total number of losses: 60; Total Number of normals: 404.
Somatic mutations of GBP4:
Generating mutation plots.
Highly correlated genes for GBP4:
Showing top 20/230 corelated genes with mean PCC>0.5.
| Gene1 | Gene2 | Mean PCC | Num. Datasets | Num. PCC<0 | Num. PCC>0.5 |
|---|---|---|---|---|---|
| GBP4 | APOL6 | 0.713428 | 6 | 0 | 5 |
| GBP4 | CXCL11 | 0.708635 | 8 | 0 | 8 |
| GBP4 | CXCL10 | 0.701905 | 8 | 0 | 8 |
| GBP4 | APOBEC3G | 0.69692 | 6 | 0 | 6 |
| GBP4 | IDO1 | 0.696535 | 8 | 0 | 8 |
| GBP4 | ZNF804A | 0.688845 | 3 | 0 | 3 |
| GBP4 | FMN1 | 0.68399 | 3 | 0 | 3 |
| GBP4 | CD8A | 0.6838 | 6 | 0 | 6 |
| GBP4 | NOA1 | 0.682532 | 3 | 0 | 3 |
| GBP4 | NKG7 | 0.671831 | 8 | 0 | 7 |
| GBP4 | SAMD9L | 0.668577 | 9 | 0 | 8 |
| GBP4 | IRF1 | 0.66683 | 7 | 0 | 6 |
| GBP4 | TRIM22 | 0.664932 | 9 | 0 | 8 |
| GBP4 | EPSTI1 | 0.664232 | 7 | 0 | 7 |
| GBP4 | BTN2A2 | 0.659274 | 4 | 0 | 3 |
| GBP4 | GZMA | 0.65779 | 8 | 0 | 6 |
| GBP4 | IFNK | 0.649028 | 3 | 0 | 3 |
| GBP4 | SIRPG | 0.648032 | 6 | 0 | 6 |
| GBP4 | UBA7 | 0.647936 | 4 | 0 | 4 |
| GBP4 | NPRL2 | 0.647853 | 3 | 0 | 3 |
For details and further investigation, click here