| Full name: G protein subunit gamma transducin 1 | Alias Symbol: GNG1 | ||
| Type: protein-coding gene | Cytoband: 7q21.3 | ||
| Entrez ID: 2792 | HGNC ID: HGNC:4411 | Ensembl Gene: ENSG00000127928 | OMIM ID: 189970 |
GNGT1 involved pathways:
Expression of GNGT1:
| Dataset | Gene | EntrezID | Probe | Log2FC | Adj.pValue | Expression |
|---|---|---|---|---|---|---|
| GSE17351 | GNGT1 | 2792 | 207166_at | 0.7058 | 0.1218 | |
| GSE20347 | GNGT1 | 2792 | 207166_at | 0.3394 | 0.0001 | |
| GSE23400 | GNGT1 | 2792 | 207166_at | 0.0349 | 0.0610 | |
| GSE26886 | GNGT1 | 2792 | 207166_at | 1.5976 | 0.0001 | |
| GSE29001 | GNGT1 | 2792 | 207166_at | 1.0876 | 0.0005 | |
| GSE38129 | GNGT1 | 2792 | 207166_at | 0.5124 | 0.0000 | |
| GSE45670 | GNGT1 | 2792 | 207166_at | 0.4829 | 0.0292 | |
| GSE53622 | GNGT1 | 2792 | 99647 | 0.6601 | 0.0000 | |
| GSE53624 | GNGT1 | 2792 | 102873 | 3.4853 | 0.0000 | |
| GSE63941 | GNGT1 | 2792 | 207166_at | 0.4339 | 0.3722 | |
| GSE77861 | GNGT1 | 2792 | 207166_at | -0.0156 | 0.8639 | |
| TCGA | GNGT1 | 2792 | RNAseq | 3.8863 | 0.0000 |
Upregulated datasets: 4; Downregulated datasets: 0.
Survival by GNGT1 expression:
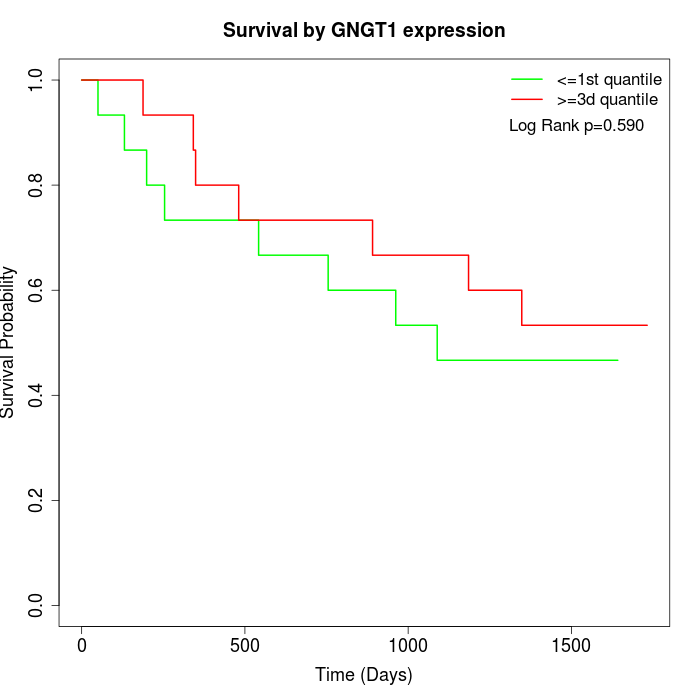 | 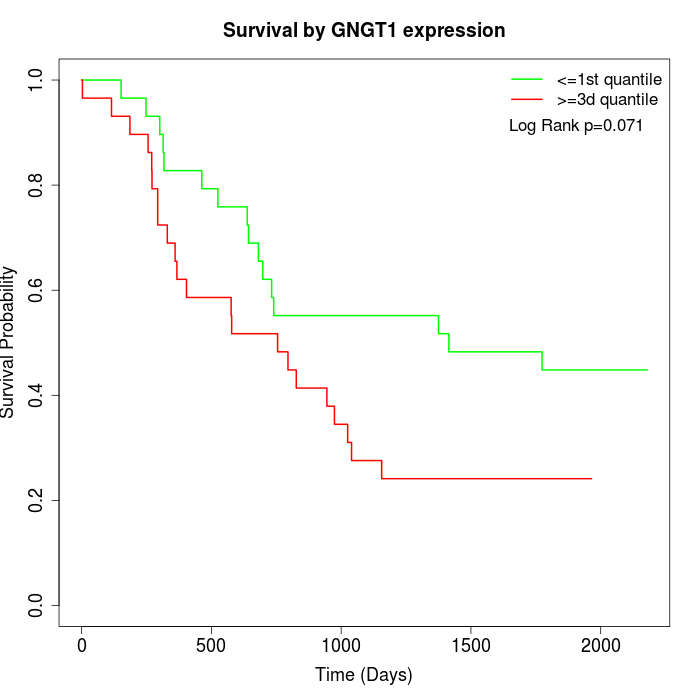 | 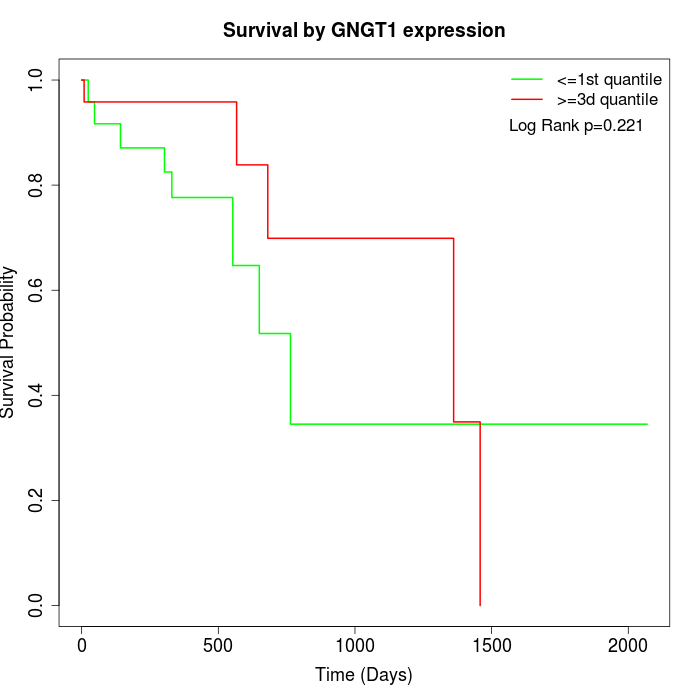 |
| GSE53622 | GSE53624 | TCGA |
Note: Click image to view full size file.
Copy number change of GNGT1:
| Dataset | Gene | EntrezID | Gain | Loss | Normal | Detail |
|---|---|---|---|---|---|---|
| GSE15526 | GNGT1 | 2792 | 13 | 0 | 17 | |
| GSE20123 | GNGT1 | 2792 | 13 | 0 | 17 | |
| GSE43470 | GNGT1 | 2792 | 7 | 1 | 35 | |
| GSE46452 | GNGT1 | 2792 | 12 | 0 | 47 | |
| GSE47630 | GNGT1 | 2792 | 9 | 2 | 29 | |
| GSE54993 | GNGT1 | 2792 | 1 | 9 | 60 | |
| GSE54994 | GNGT1 | 2792 | 16 | 2 | 35 | |
| GSE60625 | GNGT1 | 2792 | 0 | 5 | 6 | |
| GSE74703 | GNGT1 | 2792 | 6 | 1 | 29 | |
| GSE74704 | GNGT1 | 2792 | 9 | 0 | 11 | |
| TCGA | GNGT1 | 2792 | 56 | 4 | 36 |
Total number of gains: 142; Total number of losses: 24; Total Number of normals: 322.
Somatic mutations of GNGT1:
Generating mutation plots.
Highly correlated genes for GNGT1:
Showing top 20/440 corelated genes with mean PCC>0.5.
| Gene1 | Gene2 | Mean PCC | Num. Datasets | Num. PCC<0 | Num. PCC>0.5 |
|---|---|---|---|---|---|
| GNGT1 | SPATC1L | 0.721111 | 3 | 0 | 3 |
| GNGT1 | SLC45A4 | 0.703135 | 3 | 0 | 3 |
| GNGT1 | PGM2L1 | 0.690391 | 3 | 0 | 3 |
| GNGT1 | SDR39U1 | 0.686365 | 3 | 0 | 3 |
| GNGT1 | FXR1 | 0.685963 | 5 | 0 | 5 |
| GNGT1 | U2SURP | 0.669331 | 6 | 0 | 5 |
| GNGT1 | DNAJB11 | 0.666414 | 3 | 0 | 3 |
| GNGT1 | LINC01004 | 0.661613 | 3 | 0 | 3 |
| GNGT1 | KPNB1 | 0.6552 | 3 | 0 | 3 |
| GNGT1 | XCL1 | 0.647992 | 9 | 0 | 8 |
| GNGT1 | IMMP1L | 0.646666 | 4 | 0 | 3 |
| GNGT1 | HOXC10 | 0.644359 | 8 | 0 | 7 |
| GNGT1 | TRAF5 | 0.640143 | 3 | 0 | 3 |
| GNGT1 | HHIPL2 | 0.637721 | 4 | 0 | 3 |
| GNGT1 | STMN1 | 0.63682 | 7 | 0 | 6 |
| GNGT1 | ZNF680 | 0.635888 | 3 | 0 | 3 |
| GNGT1 | ADH5 | 0.635788 | 3 | 0 | 3 |
| GNGT1 | HOXD11 | 0.634719 | 9 | 0 | 7 |
| GNGT1 | RAG1 | 0.634271 | 5 | 0 | 5 |
| GNGT1 | PLXNA1 | 0.630736 | 8 | 0 | 7 |
For details and further investigation, click here