| Full name: G1 to S phase transition 1 | Alias Symbol: GST1|ETF3A|eRF3a | ||
| Type: protein-coding gene | Cytoband: 16p13.13 | ||
| Entrez ID: 2935 | HGNC ID: HGNC:4621 | Ensembl Gene: ENSG00000103342 | OMIM ID: 139259 |
Screen Evidence:
| |||
Expression of GSPT1:
| Dataset | Gene | EntrezID | Probe | Log2FC | Adj.pValue | Expression |
|---|---|---|---|---|---|---|
| GSE17351 | GSPT1 | 2935 | 215438_x_at | 0.3138 | 0.6076 | |
| GSE20347 | GSPT1 | 2935 | 215438_x_at | 0.1201 | 0.4410 | |
| GSE23400 | GSPT1 | 2935 | 215438_x_at | 0.5661 | 0.0000 | |
| GSE26886 | GSPT1 | 2935 | 215438_x_at | 0.1109 | 0.4617 | |
| GSE29001 | GSPT1 | 2935 | 215438_x_at | 0.0058 | 0.9833 | |
| GSE38129 | GSPT1 | 2935 | 215438_x_at | 0.4624 | 0.0064 | |
| GSE45670 | GSPT1 | 2935 | 215438_x_at | 0.3719 | 0.0058 | |
| GSE53622 | GSPT1 | 2935 | 66411 | -0.0887 | 0.0729 | |
| GSE53624 | GSPT1 | 2935 | 66411 | 0.0520 | 0.5272 | |
| GSE63941 | GSPT1 | 2935 | 215438_x_at | 0.4021 | 0.1853 | |
| GSE77861 | GSPT1 | 2935 | 215438_x_at | 0.0093 | 0.9805 | |
| GSE97050 | GSPT1 | 2935 | A_24_P73669 | -0.2438 | 0.6281 | |
| SRP007169 | GSPT1 | 2935 | RNAseq | -0.3984 | 0.2283 | |
| SRP008496 | GSPT1 | 2935 | RNAseq | -0.1823 | 0.3597 | |
| SRP064894 | GSPT1 | 2935 | RNAseq | -0.3975 | 0.0037 | |
| SRP133303 | GSPT1 | 2935 | RNAseq | 0.2413 | 0.1147 | |
| SRP159526 | GSPT1 | 2935 | RNAseq | -0.2346 | 0.5392 | |
| SRP193095 | GSPT1 | 2935 | RNAseq | -0.1770 | 0.0360 | |
| SRP219564 | GSPT1 | 2935 | RNAseq | -0.4104 | 0.0858 | |
| TCGA | GSPT1 | 2935 | RNAseq | -0.0431 | 0.2809 |
Upregulated datasets: 0; Downregulated datasets: 0.
Survival by GSPT1 expression:
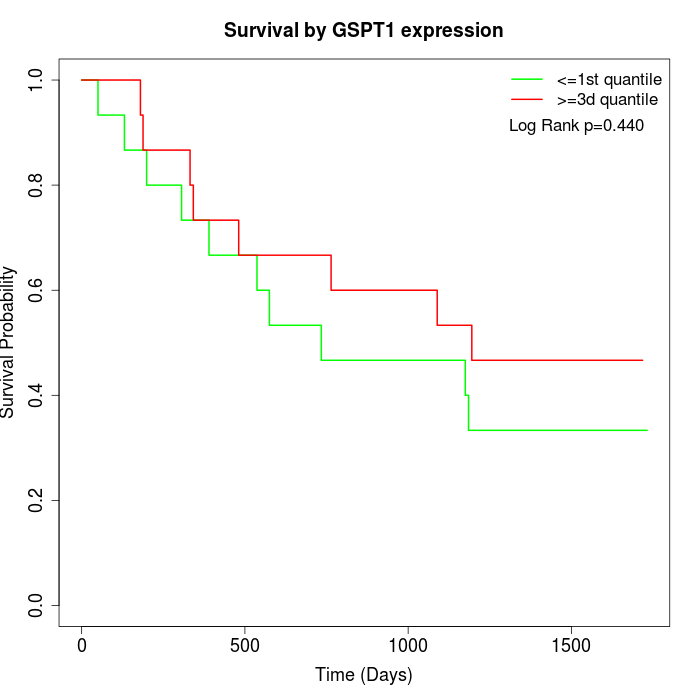 | 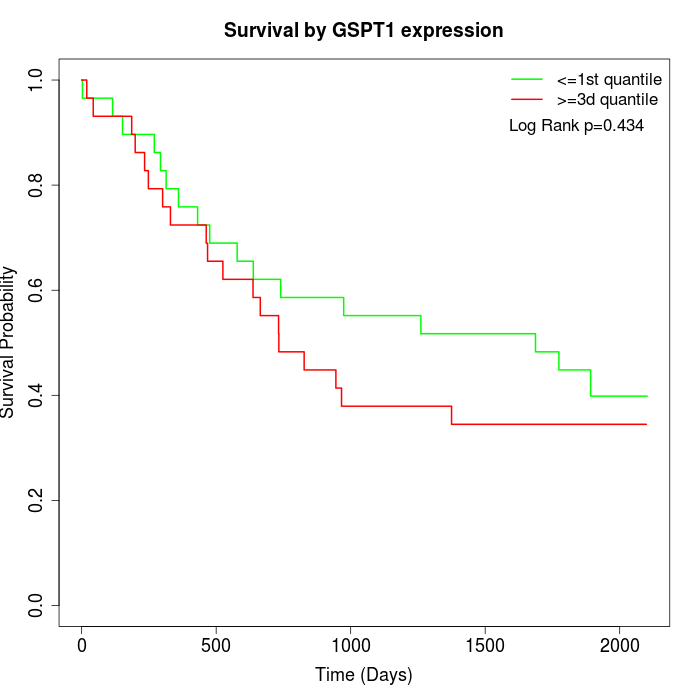 | 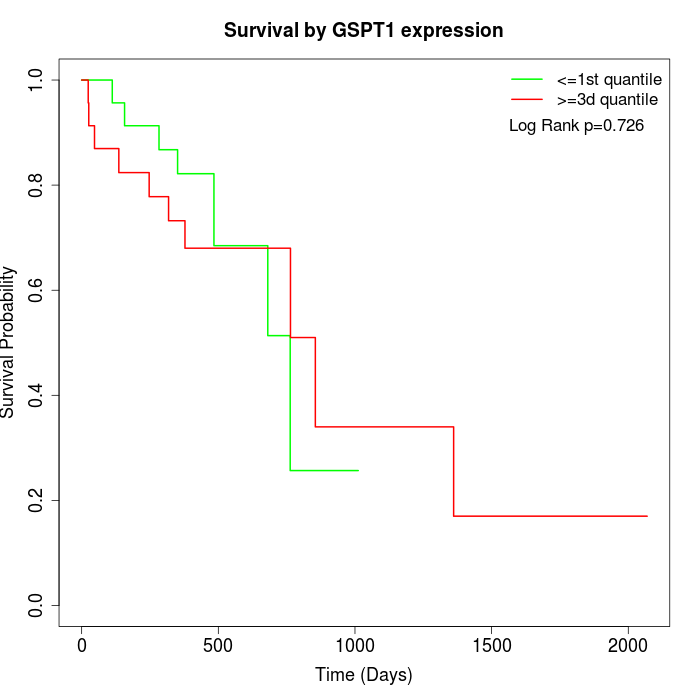 |
| GSE53622 | GSE53624 | TCGA |
Note: Click image to view full size file.
Copy number change of GSPT1:
| Dataset | Gene | EntrezID | Gain | Loss | Normal | Detail |
|---|---|---|---|---|---|---|
| GSE15526 | GSPT1 | 2935 | 4 | 4 | 22 | |
| GSE20123 | GSPT1 | 2935 | 4 | 3 | 23 | |
| GSE43470 | GSPT1 | 2935 | 3 | 3 | 37 | |
| GSE46452 | GSPT1 | 2935 | 38 | 1 | 20 | |
| GSE47630 | GSPT1 | 2935 | 14 | 6 | 20 | |
| GSE54993 | GSPT1 | 2935 | 3 | 5 | 62 | |
| GSE54994 | GSPT1 | 2935 | 5 | 9 | 39 | |
| GSE60625 | GSPT1 | 2935 | 4 | 0 | 7 | |
| GSE74703 | GSPT1 | 2935 | 3 | 2 | 31 | |
| GSE74704 | GSPT1 | 2935 | 2 | 1 | 17 | |
| TCGA | GSPT1 | 2935 | 22 | 12 | 62 |
Total number of gains: 102; Total number of losses: 46; Total Number of normals: 340.
Somatic mutations of GSPT1:
Generating mutation plots.
Highly correlated genes for GSPT1:
Showing top 20/860 corelated genes with mean PCC>0.5.
| Gene1 | Gene2 | Mean PCC | Num. Datasets | Num. PCC<0 | Num. PCC>0.5 |
|---|---|---|---|---|---|
| GSPT1 | GMCL1 | 0.777463 | 3 | 0 | 3 |
| GSPT1 | RBM7 | 0.765563 | 3 | 0 | 3 |
| GSPT1 | MVP | 0.760608 | 3 | 0 | 3 |
| GSPT1 | PSPC1 | 0.747586 | 3 | 0 | 3 |
| GSPT1 | GSR | 0.738664 | 3 | 0 | 3 |
| GSPT1 | TUFM | 0.737649 | 8 | 0 | 8 |
| GSPT1 | TMEM60 | 0.733283 | 3 | 0 | 3 |
| GSPT1 | LAMTOR1 | 0.727102 | 3 | 0 | 3 |
| GSPT1 | TRAF7 | 0.724988 | 4 | 0 | 4 |
| GSPT1 | MRPL37 | 0.72448 | 4 | 0 | 4 |
| GSPT1 | INTS12 | 0.715674 | 3 | 0 | 3 |
| GSPT1 | PPP1R8 | 0.714547 | 4 | 0 | 3 |
| GSPT1 | TTC39B | 0.711029 | 3 | 0 | 3 |
| GSPT1 | CEBPZ | 0.707243 | 3 | 0 | 3 |
| GSPT1 | TBCC | 0.70144 | 3 | 0 | 3 |
| GSPT1 | FGGY | 0.700588 | 3 | 0 | 3 |
| GSPT1 | CISD1 | 0.698648 | 4 | 0 | 4 |
| GSPT1 | GTF3C4 | 0.698066 | 4 | 0 | 4 |
| GSPT1 | CHCHD5 | 0.697693 | 3 | 0 | 3 |
| GSPT1 | NMI | 0.696959 | 3 | 0 | 3 |
For details and further investigation, click here