| Full name: integrator complex subunit 12 | Alias Symbol: SBBI22|INT12 | ||
| Type: protein-coding gene | Cytoband: 4q24 | ||
| Entrez ID: 57117 | HGNC ID: HGNC:25067 | Ensembl Gene: ENSG00000138785 | OMIM ID: 611355 |
Screen Evidence:
| |||
Expression of INTS12:
| Dataset | Gene | EntrezID | Probe | Log2FC | Adj.pValue | Expression |
|---|---|---|---|---|---|---|
| GSE17351 | INTS12 | 57117 | 218616_at | 0.0185 | 0.9691 | |
| GSE20347 | INTS12 | 57117 | 218616_at | -0.0867 | 0.5965 | |
| GSE23400 | INTS12 | 57117 | 218616_at | 0.1122 | 0.0840 | |
| GSE26886 | INTS12 | 57117 | 218616_at | 0.1323 | 0.5658 | |
| GSE29001 | INTS12 | 57117 | 218616_at | 0.0923 | 0.8637 | |
| GSE38129 | INTS12 | 57117 | 218616_at | -0.0558 | 0.6780 | |
| GSE45670 | INTS12 | 57117 | 218616_at | -0.0069 | 0.9652 | |
| GSE53622 | INTS12 | 57117 | 19951 | 0.0367 | 0.5788 | |
| GSE53624 | INTS12 | 57117 | 19951 | -0.0185 | 0.8112 | |
| GSE63941 | INTS12 | 57117 | 218616_at | 0.0719 | 0.8444 | |
| GSE77861 | INTS12 | 57117 | 218616_at | 0.0150 | 0.9691 | |
| GSE97050 | INTS12 | 57117 | A_23_P81087 | 0.1622 | 0.5272 | |
| SRP007169 | INTS12 | 57117 | RNAseq | 0.1753 | 0.7105 | |
| SRP008496 | INTS12 | 57117 | RNAseq | -0.0105 | 0.9689 | |
| SRP064894 | INTS12 | 57117 | RNAseq | -0.0626 | 0.6693 | |
| SRP133303 | INTS12 | 57117 | RNAseq | 0.5021 | 0.0069 | |
| SRP159526 | INTS12 | 57117 | RNAseq | -0.0898 | 0.7192 | |
| SRP193095 | INTS12 | 57117 | RNAseq | -0.2435 | 0.0277 | |
| SRP219564 | INTS12 | 57117 | RNAseq | -0.3307 | 0.1189 | |
| TCGA | INTS12 | 57117 | RNAseq | 0.0207 | 0.7210 |
Upregulated datasets: 0; Downregulated datasets: 0.
Survival by INTS12 expression:
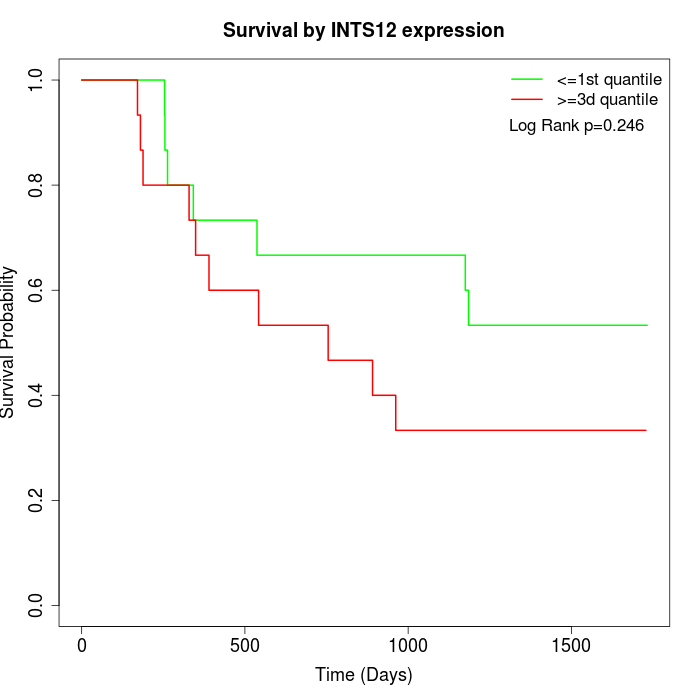 | 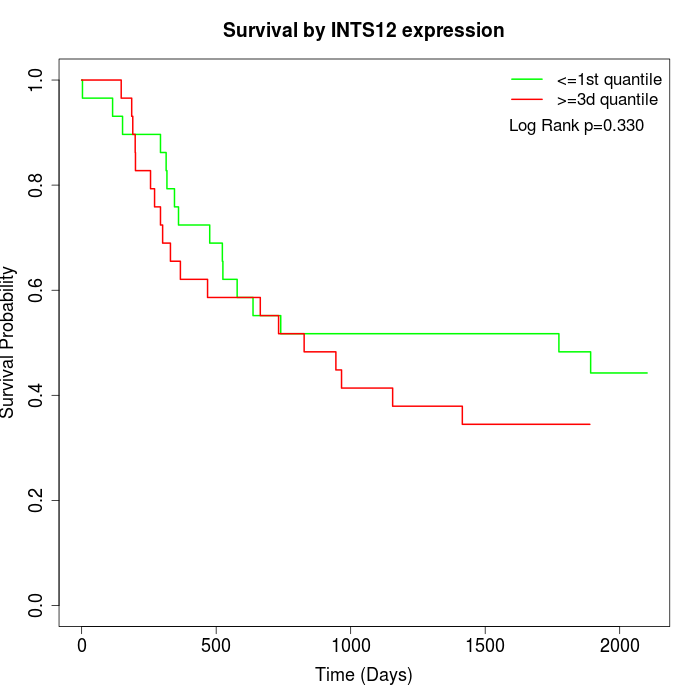 | 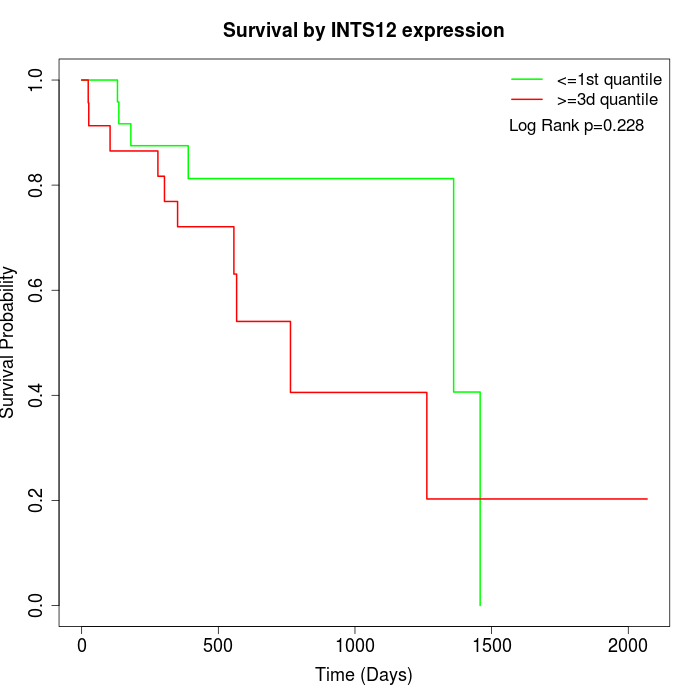 |
| GSE53622 | GSE53624 | TCGA |
Note: Click image to view full size file.
Copy number change of INTS12:
| Dataset | Gene | EntrezID | Gain | Loss | Normal | Detail |
|---|---|---|---|---|---|---|
| GSE15526 | INTS12 | 57117 | 0 | 12 | 18 | |
| GSE20123 | INTS12 | 57117 | 0 | 12 | 18 | |
| GSE43470 | INTS12 | 57117 | 0 | 13 | 30 | |
| GSE46452 | INTS12 | 57117 | 1 | 36 | 22 | |
| GSE47630 | INTS12 | 57117 | 0 | 20 | 20 | |
| GSE54993 | INTS12 | 57117 | 9 | 0 | 61 | |
| GSE54994 | INTS12 | 57117 | 1 | 10 | 42 | |
| GSE60625 | INTS12 | 57117 | 0 | 3 | 8 | |
| GSE74703 | INTS12 | 57117 | 0 | 11 | 25 | |
| GSE74704 | INTS12 | 57117 | 0 | 6 | 14 | |
| TCGA | INTS12 | 57117 | 8 | 38 | 50 |
Total number of gains: 19; Total number of losses: 161; Total Number of normals: 308.
Somatic mutations of INTS12:
Generating mutation plots.
Highly correlated genes for INTS12:
Showing top 20/644 corelated genes with mean PCC>0.5.
| Gene1 | Gene2 | Mean PCC | Num. Datasets | Num. PCC<0 | Num. PCC>0.5 |
|---|---|---|---|---|---|
| INTS12 | RPP38 | 0.791522 | 4 | 0 | 4 |
| INTS12 | CTCF | 0.787336 | 4 | 0 | 3 |
| INTS12 | CHM | 0.786552 | 3 | 0 | 3 |
| INTS12 | HMGB2 | 0.77431 | 3 | 0 | 3 |
| INTS12 | PDZD8 | 0.774235 | 3 | 0 | 3 |
| INTS12 | TMEM106B | 0.76881 | 3 | 0 | 3 |
| INTS12 | CDC123 | 0.766339 | 4 | 0 | 4 |
| INTS12 | CLP1 | 0.76589 | 3 | 0 | 3 |
| INTS12 | MTX2 | 0.759193 | 3 | 0 | 3 |
| INTS12 | CPVL | 0.755125 | 3 | 0 | 3 |
| INTS12 | CYCS | 0.741417 | 3 | 0 | 3 |
| INTS12 | TMEM69 | 0.731811 | 4 | 0 | 3 |
| INTS12 | AGGF1 | 0.730793 | 3 | 0 | 3 |
| INTS12 | NSMCE4A | 0.730652 | 5 | 0 | 5 |
| INTS12 | IDI1 | 0.727491 | 3 | 0 | 3 |
| INTS12 | COPS3 | 0.725547 | 4 | 0 | 4 |
| INTS12 | TRUB1 | 0.724003 | 3 | 0 | 3 |
| INTS12 | GPBP1 | 0.722012 | 3 | 0 | 3 |
| INTS12 | RINT1 | 0.720585 | 3 | 0 | 3 |
| INTS12 | RBM39 | 0.718494 | 4 | 0 | 3 |
For details and further investigation, click here