| Full name: general transcription factor IIIC subunit 3 | Alias Symbol: TFiiiC2-102|TFIIIC102 | ||
| Type: protein-coding gene | Cytoband: 2q33.1 | ||
| Entrez ID: 9330 | HGNC ID: HGNC:4666 | Ensembl Gene: ENSG00000119041 | OMIM ID: 604888 |
Screen Evidence:
| |||
Expression of GTF3C3:
| Dataset | Gene | EntrezID | Probe | Log2FC | Adj.pValue | Expression |
|---|---|---|---|---|---|---|
| GSE17351 | GTF3C3 | 9330 | 218343_s_at | 0.4026 | 0.2375 | |
| GSE20347 | GTF3C3 | 9330 | 218343_s_at | 0.6004 | 0.0087 | |
| GSE23400 | GTF3C3 | 9330 | 218343_s_at | 0.8036 | 0.0000 | |
| GSE26886 | GTF3C3 | 9330 | 218343_s_at | 0.7229 | 0.0163 | |
| GSE29001 | GTF3C3 | 9330 | 218343_s_at | 0.4345 | 0.1994 | |
| GSE38129 | GTF3C3 | 9330 | 218343_s_at | 0.9763 | 0.0000 | |
| GSE45670 | GTF3C3 | 9330 | 218343_s_at | 0.2704 | 0.1439 | |
| GSE53622 | GTF3C3 | 9330 | 59084 | 0.5766 | 0.0000 | |
| GSE53624 | GTF3C3 | 9330 | 59084 | 0.3884 | 0.0000 | |
| GSE63941 | GTF3C3 | 9330 | 218343_s_at | 0.8247 | 0.0508 | |
| GSE77861 | GTF3C3 | 9330 | 218343_s_at | 0.6277 | 0.0089 | |
| GSE97050 | GTF3C3 | 9330 | A_23_P429535 | 0.3362 | 0.1927 | |
| SRP007169 | GTF3C3 | 9330 | RNAseq | 0.5237 | 0.1128 | |
| SRP008496 | GTF3C3 | 9330 | RNAseq | 0.8240 | 0.0000 | |
| SRP064894 | GTF3C3 | 9330 | RNAseq | 0.1698 | 0.3425 | |
| SRP133303 | GTF3C3 | 9330 | RNAseq | 0.4502 | 0.0000 | |
| SRP159526 | GTF3C3 | 9330 | RNAseq | 0.3633 | 0.0403 | |
| SRP193095 | GTF3C3 | 9330 | RNAseq | 0.1554 | 0.1011 | |
| SRP219564 | GTF3C3 | 9330 | RNAseq | -0.0244 | 0.9245 | |
| TCGA | GTF3C3 | 9330 | RNAseq | 0.1361 | 0.0081 |
Upregulated datasets: 0; Downregulated datasets: 0.
Survival by GTF3C3 expression:
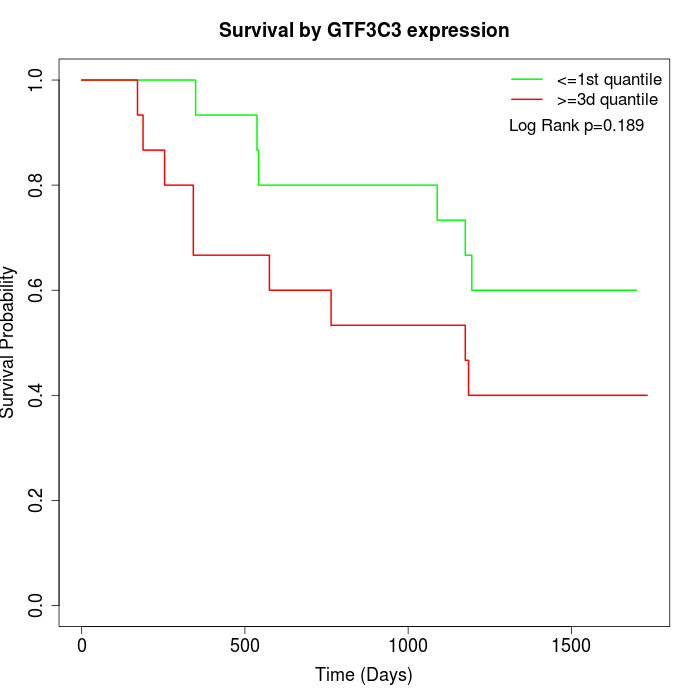 | 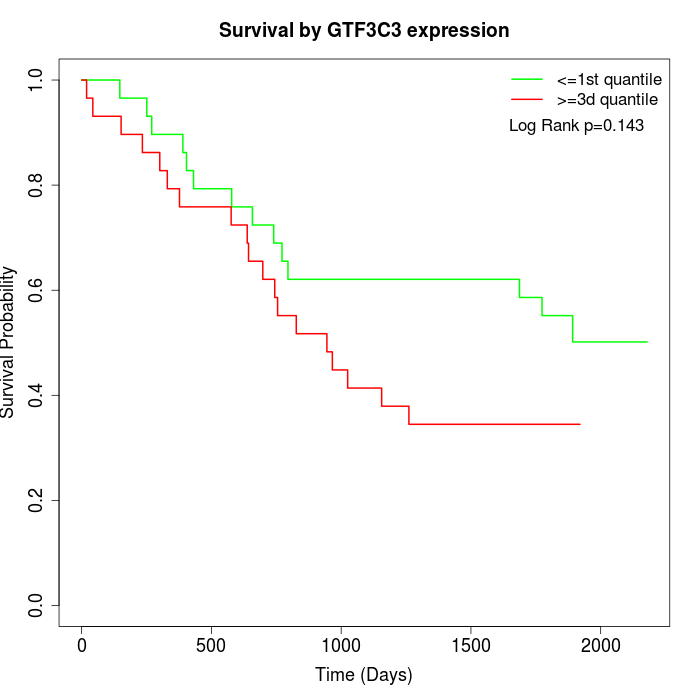 | 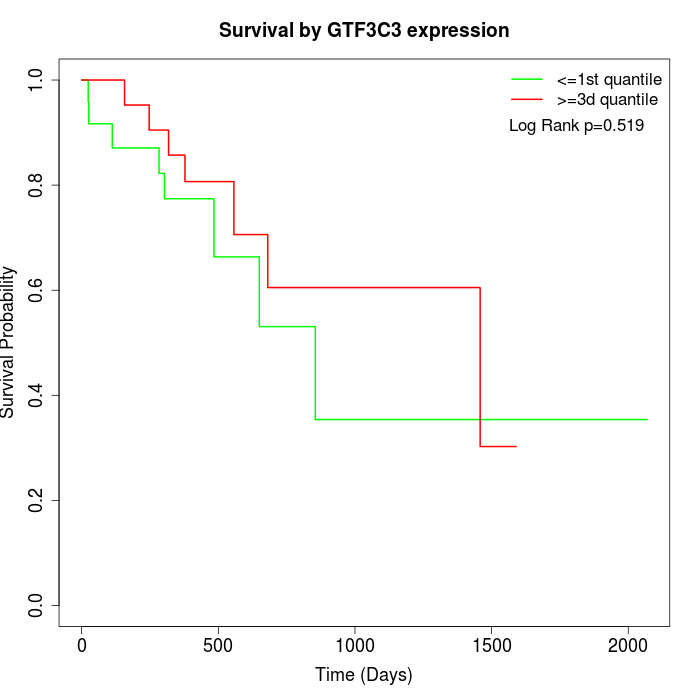 |
| GSE53622 | GSE53624 | TCGA |
Note: Click image to view full size file.
Copy number change of GTF3C3:
| Dataset | Gene | EntrezID | Gain | Loss | Normal | Detail |
|---|---|---|---|---|---|---|
| GSE15526 | GTF3C3 | 9330 | 10 | 2 | 18 | |
| GSE20123 | GTF3C3 | 9330 | 10 | 2 | 18 | |
| GSE43470 | GTF3C3 | 9330 | 3 | 1 | 39 | |
| GSE46452 | GTF3C3 | 9330 | 1 | 4 | 54 | |
| GSE47630 | GTF3C3 | 9330 | 4 | 5 | 31 | |
| GSE54993 | GTF3C3 | 9330 | 0 | 4 | 66 | |
| GSE54994 | GTF3C3 | 9330 | 11 | 7 | 35 | |
| GSE60625 | GTF3C3 | 9330 | 0 | 3 | 8 | |
| GSE74703 | GTF3C3 | 9330 | 2 | 1 | 33 | |
| GSE74704 | GTF3C3 | 9330 | 5 | 2 | 13 | |
| TCGA | GTF3C3 | 9330 | 22 | 9 | 65 |
Total number of gains: 68; Total number of losses: 40; Total Number of normals: 380.
Somatic mutations of GTF3C3:
Generating mutation plots.
Highly correlated genes for GTF3C3:
Showing top 20/1477 corelated genes with mean PCC>0.5.
| Gene1 | Gene2 | Mean PCC | Num. Datasets | Num. PCC<0 | Num. PCC>0.5 |
|---|---|---|---|---|---|
| GTF3C3 | TMTC3 | 0.755066 | 3 | 0 | 3 |
| GTF3C3 | VMA21 | 0.725693 | 5 | 0 | 4 |
| GTF3C3 | RNASET2 | 0.718479 | 3 | 0 | 3 |
| GTF3C3 | RAC2 | 0.716535 | 3 | 0 | 3 |
| GTF3C3 | NFKB1 | 0.714593 | 3 | 0 | 3 |
| GTF3C3 | FCER1G | 0.70733 | 3 | 0 | 3 |
| GTF3C3 | PLEKHA8 | 0.705113 | 3 | 0 | 3 |
| GTF3C3 | YWHAG | 0.698717 | 3 | 0 | 3 |
| GTF3C3 | PYCR2 | 0.695958 | 3 | 0 | 3 |
| GTF3C3 | NIF3L1 | 0.693959 | 13 | 0 | 12 |
| GTF3C3 | RNF166 | 0.69238 | 3 | 0 | 3 |
| GTF3C3 | XPNPEP3 | 0.692256 | 4 | 0 | 3 |
| GTF3C3 | HSPD1 | 0.690776 | 12 | 0 | 10 |
| GTF3C3 | PARVB | 0.690588 | 3 | 0 | 3 |
| GTF3C3 | ELF2 | 0.688836 | 3 | 0 | 3 |
| GTF3C3 | POLDIP2 | 0.68635 | 4 | 0 | 4 |
| GTF3C3 | SMCR8 | 0.679811 | 6 | 0 | 5 |
| GTF3C3 | DCUN1D2 | 0.679281 | 3 | 0 | 3 |
| GTF3C3 | PEX2 | 0.67824 | 4 | 0 | 4 |
| GTF3C3 | WDR75 | 0.677619 | 7 | 0 | 6 |
For details and further investigation, click here