| Full name: GTP binding protein 2 | Alias Symbol: | ||
| Type: protein-coding gene | Cytoband: 6p21.1 | ||
| Entrez ID: 54676 | HGNC ID: HGNC:4670 | Ensembl Gene: ENSG00000172432 | OMIM ID: 607434 |
Expression of GTPBP2:
| Dataset | Gene | EntrezID | Probe | Log2FC | Adj.pValue | Expression |
|---|---|---|---|---|---|---|
| GSE17351 | GTPBP2 | 54676 | 221050_s_at | -0.4166 | 0.4406 | |
| GSE20347 | GTPBP2 | 54676 | 221050_s_at | -0.7908 | 0.0000 | |
| GSE23400 | GTPBP2 | 54676 | 221050_s_at | -0.4409 | 0.0000 | |
| GSE26886 | GTPBP2 | 54676 | 221050_s_at | -1.2211 | 0.0000 | |
| GSE29001 | GTPBP2 | 54676 | 221050_s_at | -0.2629 | 0.2631 | |
| GSE38129 | GTPBP2 | 54676 | 221050_s_at | -0.4224 | 0.0039 | |
| GSE45670 | GTPBP2 | 54676 | 221050_s_at | -0.0337 | 0.8749 | |
| GSE53622 | GTPBP2 | 54676 | 16925 | -0.6431 | 0.0000 | |
| GSE53624 | GTPBP2 | 54676 | 16925 | -0.7009 | 0.0000 | |
| GSE63941 | GTPBP2 | 54676 | 221050_s_at | 1.3237 | 0.0360 | |
| GSE77861 | GTPBP2 | 54676 | 223788_at | -0.1887 | 0.3436 | |
| GSE97050 | GTPBP2 | 54676 | A_24_P298013 | 0.1865 | 0.6264 | |
| SRP007169 | GTPBP2 | 54676 | RNAseq | -2.5429 | 0.0000 | |
| SRP008496 | GTPBP2 | 54676 | RNAseq | -2.3788 | 0.0000 | |
| SRP064894 | GTPBP2 | 54676 | RNAseq | -0.5221 | 0.0074 | |
| SRP133303 | GTPBP2 | 54676 | RNAseq | -0.4842 | 0.0000 | |
| SRP159526 | GTPBP2 | 54676 | RNAseq | -0.9807 | 0.0010 | |
| SRP193095 | GTPBP2 | 54676 | RNAseq | -0.6050 | 0.0001 | |
| SRP219564 | GTPBP2 | 54676 | RNAseq | -0.6903 | 0.1079 | |
| TCGA | GTPBP2 | 54676 | RNAseq | 0.0642 | 0.2252 |
Upregulated datasets: 1; Downregulated datasets: 3.
Survival by GTPBP2 expression:
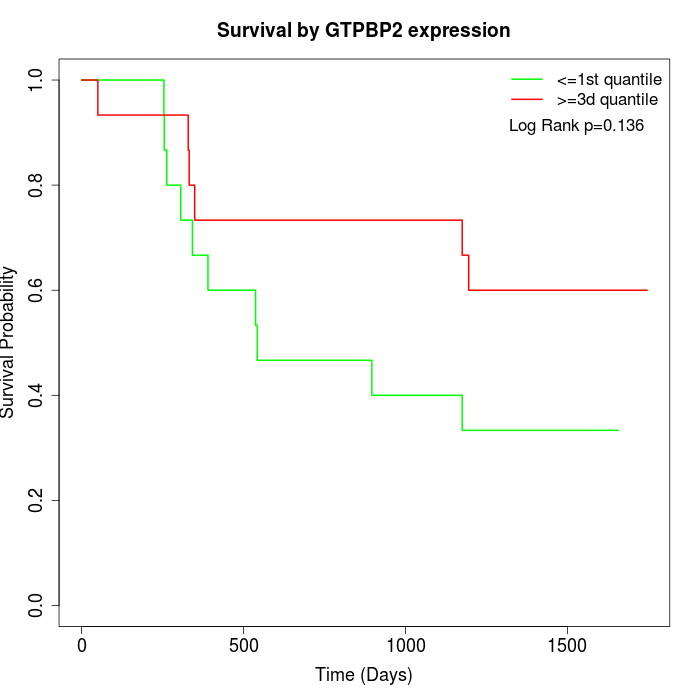 | 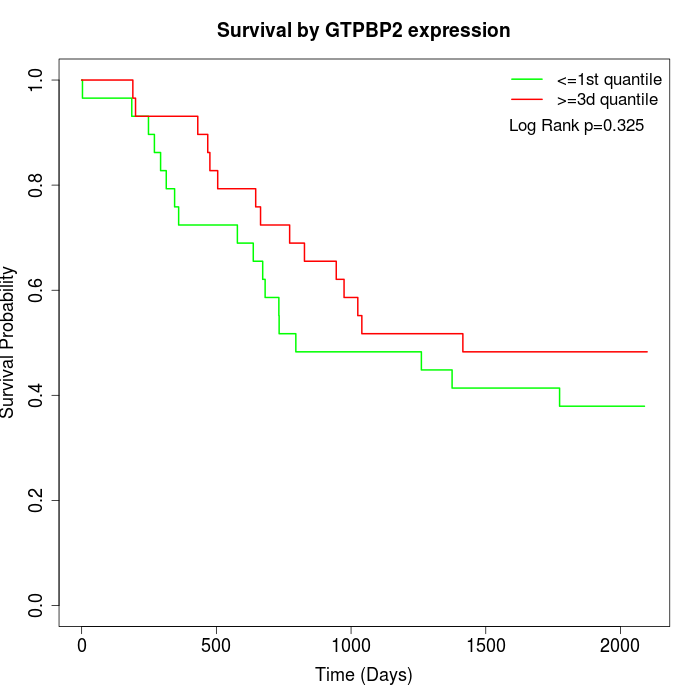 | 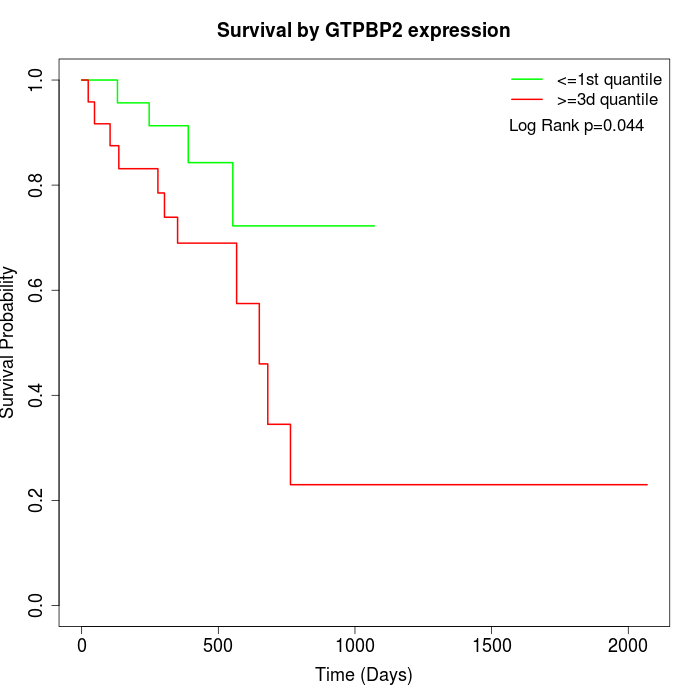 |
| GSE53622 | GSE53624 | TCGA |
Note: Click image to view full size file.
Copy number change of GTPBP2:
| Dataset | Gene | EntrezID | Gain | Loss | Normal | Detail |
|---|---|---|---|---|---|---|
| GSE15526 | GTPBP2 | 54676 | 7 | 0 | 23 | |
| GSE20123 | GTPBP2 | 54676 | 7 | 0 | 23 | |
| GSE43470 | GTPBP2 | 54676 | 6 | 0 | 37 | |
| GSE46452 | GTPBP2 | 54676 | 2 | 9 | 48 | |
| GSE47630 | GTPBP2 | 54676 | 8 | 4 | 28 | |
| GSE54993 | GTPBP2 | 54676 | 3 | 2 | 65 | |
| GSE54994 | GTPBP2 | 54676 | 11 | 4 | 38 | |
| GSE60625 | GTPBP2 | 54676 | 0 | 1 | 10 | |
| GSE74703 | GTPBP2 | 54676 | 6 | 0 | 30 | |
| GSE74704 | GTPBP2 | 54676 | 3 | 0 | 17 | |
| TCGA | GTPBP2 | 54676 | 22 | 11 | 63 |
Total number of gains: 75; Total number of losses: 31; Total Number of normals: 382.
Somatic mutations of GTPBP2:
Generating mutation plots.
Highly correlated genes for GTPBP2:
Showing top 20/1201 corelated genes with mean PCC>0.5.
| Gene1 | Gene2 | Mean PCC | Num. Datasets | Num. PCC<0 | Num. PCC>0.5 |
|---|---|---|---|---|---|
| GTPBP2 | GPR132 | 0.733289 | 3 | 0 | 3 |
| GTPBP2 | KCNK2 | 0.723617 | 3 | 0 | 3 |
| GTPBP2 | PHF23 | 0.722256 | 3 | 0 | 3 |
| GTPBP2 | ABHD12 | 0.718376 | 3 | 0 | 3 |
| GTPBP2 | DOC2B | 0.716572 | 4 | 0 | 4 |
| GTPBP2 | IRX3 | 0.713274 | 3 | 0 | 3 |
| GTPBP2 | SESN2 | 0.710471 | 7 | 0 | 7 |
| GTPBP2 | KIF21A | 0.70793 | 3 | 0 | 3 |
| GTPBP2 | PHLDA1 | 0.706355 | 8 | 0 | 7 |
| GTPBP2 | ADCYAP1 | 0.704214 | 3 | 0 | 3 |
| GTPBP2 | SCAF4 | 0.702372 | 3 | 0 | 3 |
| GTPBP2 | MLKL | 0.702321 | 3 | 0 | 3 |
| GTPBP2 | OPHN1 | 0.700587 | 6 | 0 | 5 |
| GTPBP2 | WDR26 | 0.698624 | 10 | 0 | 8 |
| GTPBP2 | SRD5A3-AS1 | 0.695559 | 3 | 0 | 3 |
| GTPBP2 | PLCB3 | 0.695557 | 4 | 0 | 4 |
| GTPBP2 | SH3GL1 | 0.695225 | 11 | 0 | 10 |
| GTPBP2 | DEAF1 | 0.693652 | 6 | 0 | 6 |
| GTPBP2 | DUSP18 | 0.692286 | 3 | 0 | 3 |
| GTPBP2 | RNF31 | 0.691604 | 4 | 0 | 3 |
For details and further investigation, click here