| Full name: IK cytokine | Alias Symbol: RED|RER | ||
| Type: protein-coding gene | Cytoband: 5q31.3 | ||
| Entrez ID: 3550 | HGNC ID: HGNC:5958 | Ensembl Gene: ENSG00000113141 | OMIM ID: 600549 |
Screen Evidence:
| |||
Expression of IK:
| Dataset | Gene | EntrezID | Probe | Log2FC | Adj.pValue | Expression |
|---|---|---|---|---|---|---|
| GSE17351 | IK | 3550 | 200066_at | -0.7278 | 0.0511 | |
| GSE20347 | IK | 3550 | 200066_at | -0.5269 | 0.0001 | |
| GSE23400 | IK | 3550 | 200066_at | -0.3908 | 0.0000 | |
| GSE26886 | IK | 3550 | 200066_at | -0.7373 | 0.0007 | |
| GSE29001 | IK | 3550 | 200066_at | -0.5298 | 0.0203 | |
| GSE38129 | IK | 3550 | 200066_at | -0.5335 | 0.0000 | |
| GSE45670 | IK | 3550 | 200066_at | -0.3807 | 0.0031 | |
| GSE53622 | IK | 3550 | 29677 | -0.6426 | 0.0000 | |
| GSE53624 | IK | 3550 | 29677 | -0.6251 | 0.0000 | |
| GSE63941 | IK | 3550 | 200066_at | 0.1701 | 0.5734 | |
| GSE77861 | IK | 3550 | 200066_at | -0.4887 | 0.0528 | |
| GSE97050 | IK | 3550 | A_23_P133245 | -0.4525 | 0.1372 | |
| SRP007169 | IK | 3550 | RNAseq | -0.6382 | 0.2877 | |
| SRP008496 | IK | 3550 | RNAseq | -0.3926 | 0.2887 | |
| SRP064894 | IK | 3550 | RNAseq | -0.5393 | 0.0000 | |
| SRP133303 | IK | 3550 | RNAseq | -0.3179 | 0.1434 | |
| SRP159526 | IK | 3550 | RNAseq | -0.6949 | 0.0416 | |
| SRP193095 | IK | 3550 | RNAseq | -0.7538 | 0.0000 | |
| SRP219564 | IK | 3550 | RNAseq | -0.6604 | 0.0059 | |
| TCGA | IK | 3550 | RNAseq | -0.0491 | 0.2977 |
Upregulated datasets: 0; Downregulated datasets: 0.
Survival by IK expression:
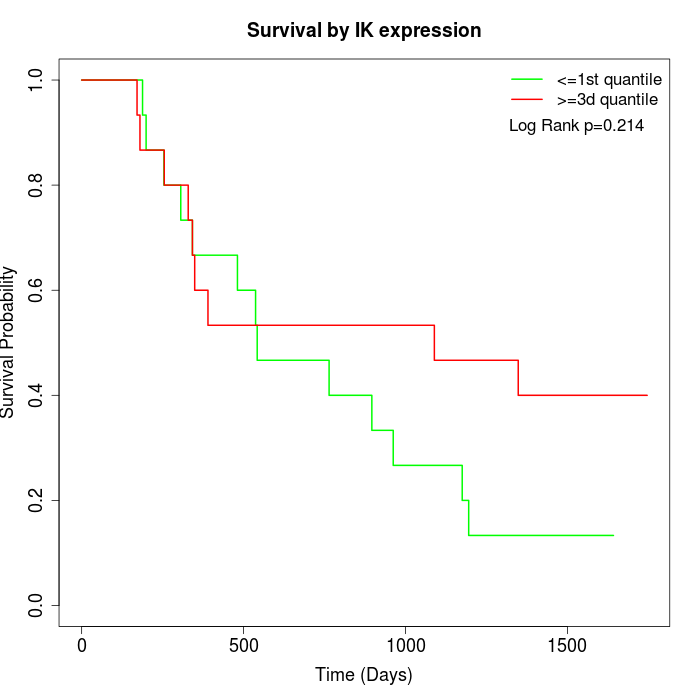 | 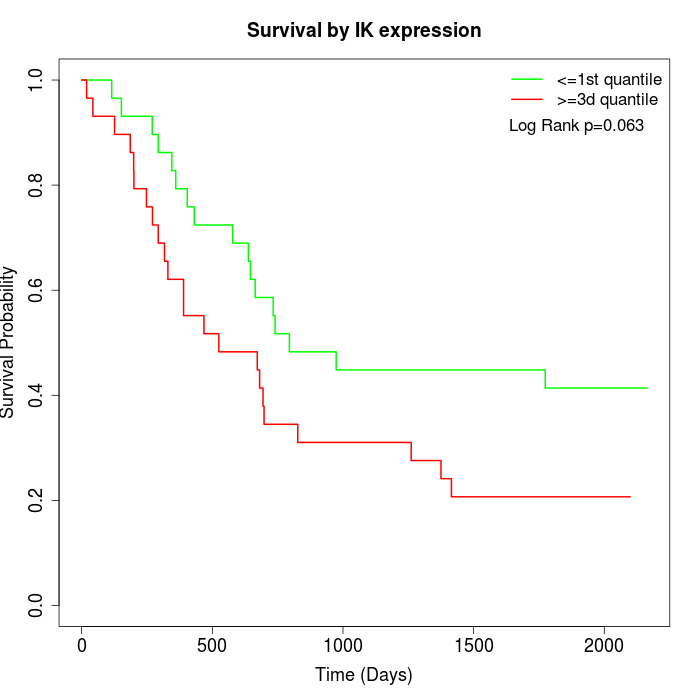 | 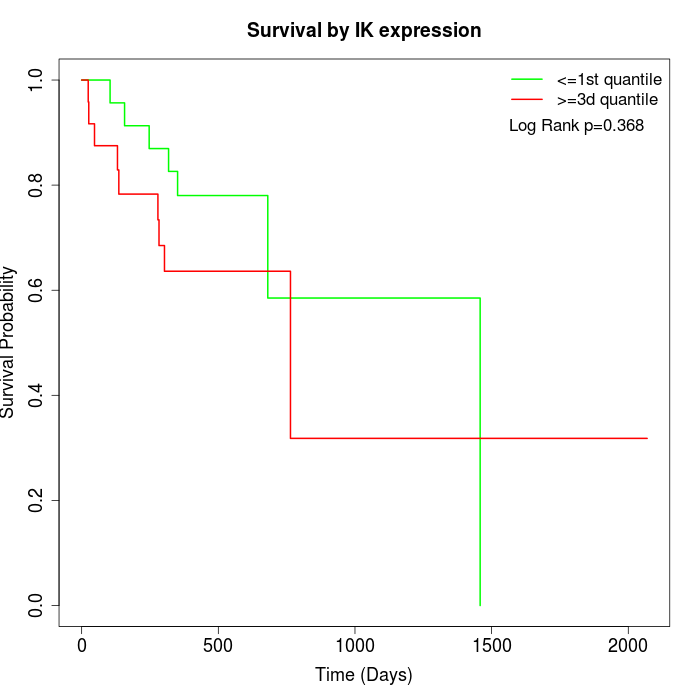 |
| GSE53622 | GSE53624 | TCGA |
Note: Click image to view full size file.
Copy number change of IK:
| Dataset | Gene | EntrezID | Gain | Loss | Normal | Detail |
|---|---|---|---|---|---|---|
| GSE15526 | IK | 3550 | 3 | 11 | 16 | |
| GSE20123 | IK | 3550 | 4 | 11 | 15 | |
| GSE43470 | IK | 3550 | 2 | 10 | 31 | |
| GSE46452 | IK | 3550 | 0 | 27 | 32 | |
| GSE47630 | IK | 3550 | 0 | 20 | 20 | |
| GSE54993 | IK | 3550 | 9 | 1 | 60 | |
| GSE54994 | IK | 3550 | 2 | 14 | 37 | |
| GSE60625 | IK | 3550 | 0 | 0 | 11 | |
| GSE74703 | IK | 3550 | 2 | 7 | 27 | |
| GSE74704 | IK | 3550 | 3 | 5 | 12 | |
| TCGA | IK | 3550 | 4 | 37 | 55 |
Total number of gains: 29; Total number of losses: 143; Total Number of normals: 316.
Somatic mutations of IK:
Generating mutation plots.
Highly correlated genes for IK:
Showing top 20/1594 corelated genes with mean PCC>0.5.
| Gene1 | Gene2 | Mean PCC | Num. Datasets | Num. PCC<0 | Num. PCC>0.5 |
|---|---|---|---|---|---|
| IK | NSRP1 | 0.817787 | 3 | 0 | 3 |
| IK | FCHO2 | 0.791976 | 7 | 0 | 7 |
| IK | ARRDC3 | 0.780591 | 7 | 0 | 7 |
| IK | CTTNBP2NL | 0.779169 | 6 | 0 | 6 |
| IK | CPEB4 | 0.768074 | 6 | 0 | 6 |
| IK | MRPS36 | 0.758608 | 8 | 0 | 7 |
| IK | AK3 | 0.751461 | 7 | 0 | 7 |
| IK | ZNF564 | 0.741274 | 3 | 0 | 3 |
| IK | DMXL1 | 0.739704 | 12 | 0 | 11 |
| IK | LRRFIP2 | 0.738577 | 11 | 0 | 11 |
| IK | PITHD1 | 0.73839 | 6 | 0 | 6 |
| IK | RC3H1 | 0.737504 | 3 | 0 | 3 |
| IK | CLEC3B | 0.736657 | 3 | 0 | 3 |
| IK | GAB1 | 0.734899 | 8 | 0 | 8 |
| IK | SKP1 | 0.734706 | 10 | 0 | 9 |
| IK | RRAGC | 0.731943 | 3 | 0 | 3 |
| IK | TMEM132C | 0.731851 | 3 | 0 | 3 |
| IK | ANKRD37 | 0.731642 | 5 | 0 | 5 |
| IK | FAM174A | 0.731168 | 8 | 0 | 7 |
| IK | CALCOCO2 | 0.728311 | 11 | 0 | 10 |
For details and further investigation, click here