| Full name: integrin subunit beta 3 binding protein | Alias Symbol: NRIF3|HSU37139|TAP20|CENPR | ||
| Type: protein-coding gene | Cytoband: 1p31.3 | ||
| Entrez ID: 23421 | HGNC ID: HGNC:6157 | Ensembl Gene: ENSG00000142856 | OMIM ID: 605494 |
Expression of ITGB3BP:
| Dataset | Gene | EntrezID | Probe | Log2FC | Adj.pValue | Expression |
|---|---|---|---|---|---|---|
| GSE17351 | ITGB3BP | 23421 | 205176_s_at | 0.3004 | 0.4819 | |
| GSE20347 | ITGB3BP | 23421 | 205176_s_at | 0.5405 | 0.0311 | |
| GSE23400 | ITGB3BP | 23421 | 205176_s_at | 0.4319 | 0.0000 | |
| GSE26886 | ITGB3BP | 23421 | 205176_s_at | 1.2579 | 0.0000 | |
| GSE29001 | ITGB3BP | 23421 | 205176_s_at | 0.6126 | 0.2225 | |
| GSE38129 | ITGB3BP | 23421 | 205176_s_at | 0.4449 | 0.0155 | |
| GSE45670 | ITGB3BP | 23421 | 205176_s_at | 0.3066 | 0.0881 | |
| GSE53622 | ITGB3BP | 23421 | 59869 | 0.4445 | 0.0000 | |
| GSE53624 | ITGB3BP | 23421 | 59869 | 0.4822 | 0.0000 | |
| GSE63941 | ITGB3BP | 23421 | 205176_s_at | 1.3097 | 0.0188 | |
| GSE77861 | ITGB3BP | 23421 | 205176_s_at | 0.2164 | 0.4299 | |
| GSE97050 | ITGB3BP | 23421 | A_23_P23765 | 0.2895 | 0.3376 | |
| SRP007169 | ITGB3BP | 23421 | RNAseq | 0.6051 | 0.1845 | |
| SRP008496 | ITGB3BP | 23421 | RNAseq | 0.4243 | 0.2229 | |
| SRP064894 | ITGB3BP | 23421 | RNAseq | 0.4726 | 0.0328 | |
| SRP133303 | ITGB3BP | 23421 | RNAseq | 0.6051 | 0.0160 | |
| SRP159526 | ITGB3BP | 23421 | RNAseq | -0.0527 | 0.8884 | |
| SRP193095 | ITGB3BP | 23421 | RNAseq | -0.0935 | 0.5318 | |
| SRP219564 | ITGB3BP | 23421 | RNAseq | 0.0305 | 0.9360 | |
| TCGA | ITGB3BP | 23421 | RNAseq | 0.2475 | 0.0004 |
Upregulated datasets: 2; Downregulated datasets: 0.
Survival by ITGB3BP expression:
 | 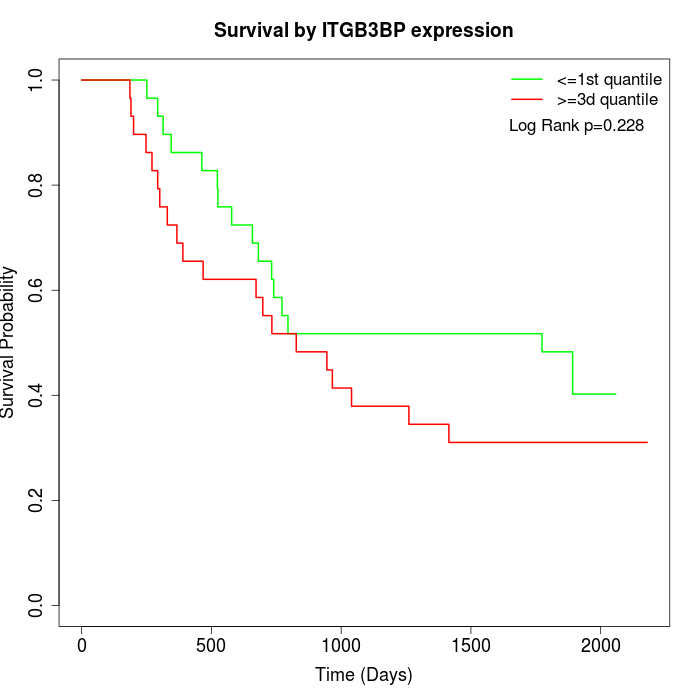 | 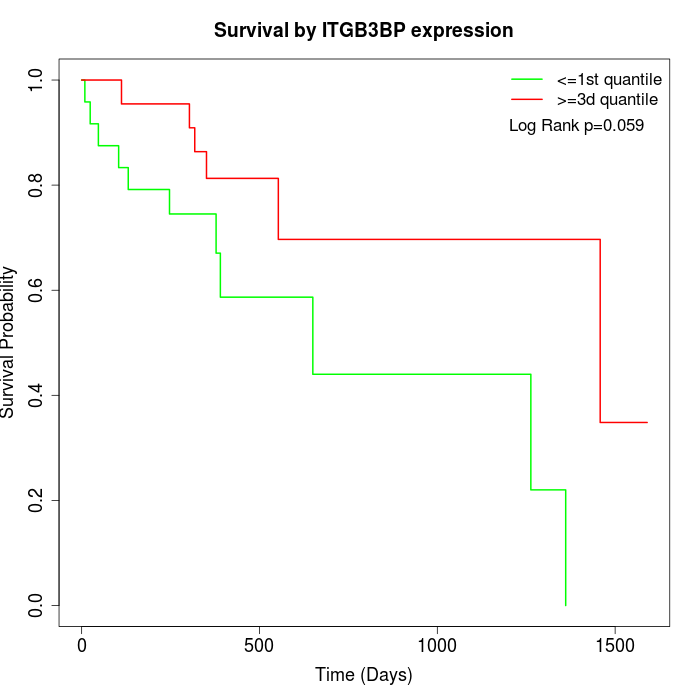 |
| GSE53622 | GSE53624 | TCGA |
Note: Click image to view full size file.
Copy number change of ITGB3BP:
| Dataset | Gene | EntrezID | Gain | Loss | Normal | Detail |
|---|---|---|---|---|---|---|
| GSE15526 | ITGB3BP | 23421 | 3 | 6 | 21 | |
| GSE20123 | ITGB3BP | 23421 | 3 | 5 | 22 | |
| GSE43470 | ITGB3BP | 23421 | 5 | 4 | 34 | |
| GSE46452 | ITGB3BP | 23421 | 1 | 1 | 57 | |
| GSE47630 | ITGB3BP | 23421 | 8 | 5 | 27 | |
| GSE54993 | ITGB3BP | 23421 | 0 | 0 | 70 | |
| GSE54994 | ITGB3BP | 23421 | 6 | 4 | 43 | |
| GSE60625 | ITGB3BP | 23421 | 0 | 0 | 11 | |
| GSE74703 | ITGB3BP | 23421 | 4 | 3 | 29 | |
| GSE74704 | ITGB3BP | 23421 | 2 | 2 | 16 | |
| TCGA | ITGB3BP | 23421 | 10 | 21 | 65 |
Total number of gains: 42; Total number of losses: 51; Total Number of normals: 395.
Somatic mutations of ITGB3BP:
Generating mutation plots.
Highly correlated genes for ITGB3BP:
Showing top 20/486 corelated genes with mean PCC>0.5.
| Gene1 | Gene2 | Mean PCC | Num. Datasets | Num. PCC<0 | Num. PCC>0.5 |
|---|---|---|---|---|---|
| ITGB3BP | RHPN2 | 0.706816 | 4 | 0 | 4 |
| ITGB3BP | USP1 | 0.70304 | 12 | 0 | 12 |
| ITGB3BP | MAPKAPK5-AS1 | 0.667468 | 6 | 0 | 5 |
| ITGB3BP | HSPB11 | 0.665498 | 11 | 0 | 9 |
| ITGB3BP | NPW | 0.661195 | 3 | 0 | 3 |
| ITGB3BP | FANCL | 0.656035 | 7 | 0 | 6 |
| ITGB3BP | NDC1 | 0.650155 | 11 | 0 | 10 |
| ITGB3BP | MTFP1 | 0.640947 | 4 | 0 | 4 |
| ITGB3BP | TXNDC12 | 0.638591 | 8 | 0 | 8 |
| ITGB3BP | SLC29A2 | 0.633814 | 4 | 0 | 3 |
| ITGB3BP | C10orf55 | 0.632483 | 3 | 0 | 3 |
| ITGB3BP | DNTTIP1 | 0.630635 | 5 | 0 | 4 |
| ITGB3BP | CENPH | 0.629361 | 5 | 0 | 5 |
| ITGB3BP | FBXO5 | 0.622055 | 11 | 0 | 11 |
| ITGB3BP | MSH2 | 0.617537 | 10 | 0 | 8 |
| ITGB3BP | WDR54 | 0.616254 | 5 | 0 | 5 |
| ITGB3BP | IRX2 | 0.614212 | 4 | 0 | 3 |
| ITGB3BP | YBX1 | 0.612017 | 8 | 0 | 5 |
| ITGB3BP | FAF1 | 0.609527 | 7 | 0 | 4 |
| ITGB3BP | C17orf75 | 0.608984 | 5 | 0 | 5 |
For details and further investigation, click here