| Full name: F-box protein 5 | Alias Symbol: FBX5|Fbxo31|EMI1 | ||
| Type: protein-coding gene | Cytoband: 6q25.2 | ||
| Entrez ID: 26271 | HGNC ID: HGNC:13584 | Ensembl Gene: ENSG00000112029 | OMIM ID: 606013 |
FBXO5 involved pathways:
| KEGG pathway | Description | View |
|---|---|---|
| hsa04114 | Oocyte meiosis |
Expression of FBXO5:
| Dataset | Gene | EntrezID | Probe | Log2FC | Adj.pValue | Expression |
|---|---|---|---|---|---|---|
| GSE17351 | FBXO5 | 26271 | 234863_x_at | 0.7805 | 0.0700 | |
| GSE20347 | FBXO5 | 26271 | 218875_s_at | 1.2316 | 0.0000 | |
| GSE23400 | FBXO5 | 26271 | 218875_s_at | 0.6982 | 0.0000 | |
| GSE26886 | FBXO5 | 26271 | 218875_s_at | 0.0146 | 0.9739 | |
| GSE29001 | FBXO5 | 26271 | 218875_s_at | 1.6353 | 0.0004 | |
| GSE38129 | FBXO5 | 26271 | 218875_s_at | 1.3673 | 0.0000 | |
| GSE45670 | FBXO5 | 26271 | 218875_s_at | 1.1130 | 0.0001 | |
| GSE53622 | FBXO5 | 26271 | 117460 | 1.0386 | 0.0000 | |
| GSE53624 | FBXO5 | 26271 | 117460 | 1.3970 | 0.0000 | |
| GSE63941 | FBXO5 | 26271 | 218875_s_at | 1.6223 | 0.0009 | |
| GSE77861 | FBXO5 | 26271 | 234863_x_at | 0.4841 | 0.0204 | |
| GSE97050 | FBXO5 | 26271 | A_33_P3384871 | 0.7440 | 0.2237 | |
| SRP007169 | FBXO5 | 26271 | RNAseq | 2.2769 | 0.0000 | |
| SRP008496 | FBXO5 | 26271 | RNAseq | 1.9033 | 0.0000 | |
| SRP064894 | FBXO5 | 26271 | RNAseq | 1.1889 | 0.0000 | |
| SRP133303 | FBXO5 | 26271 | RNAseq | 1.4495 | 0.0000 | |
| SRP159526 | FBXO5 | 26271 | RNAseq | 0.9817 | 0.0111 | |
| SRP193095 | FBXO5 | 26271 | RNAseq | 0.6863 | 0.0000 | |
| SRP219564 | FBXO5 | 26271 | RNAseq | 0.5734 | 0.1234 | |
| TCGA | FBXO5 | 26271 | RNAseq | 0.5238 | 0.0000 |
Upregulated datasets: 11; Downregulated datasets: 0.
Survival by FBXO5 expression:
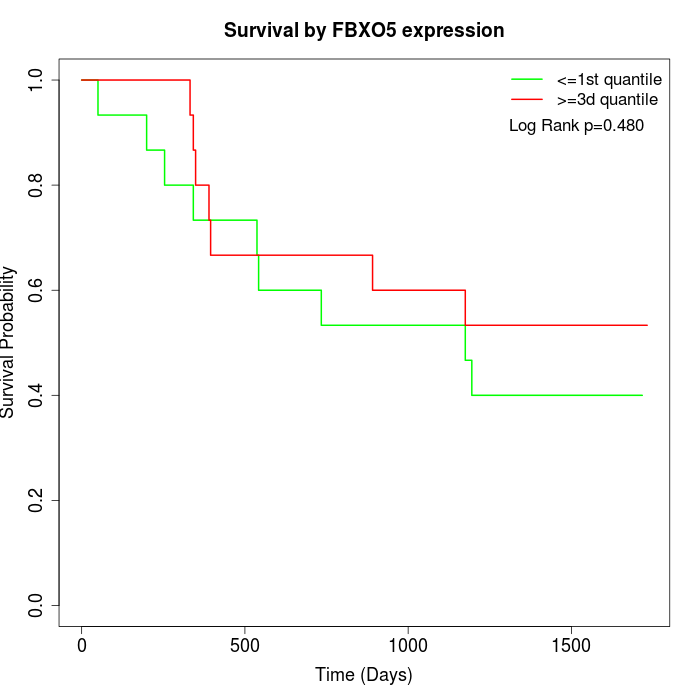 | 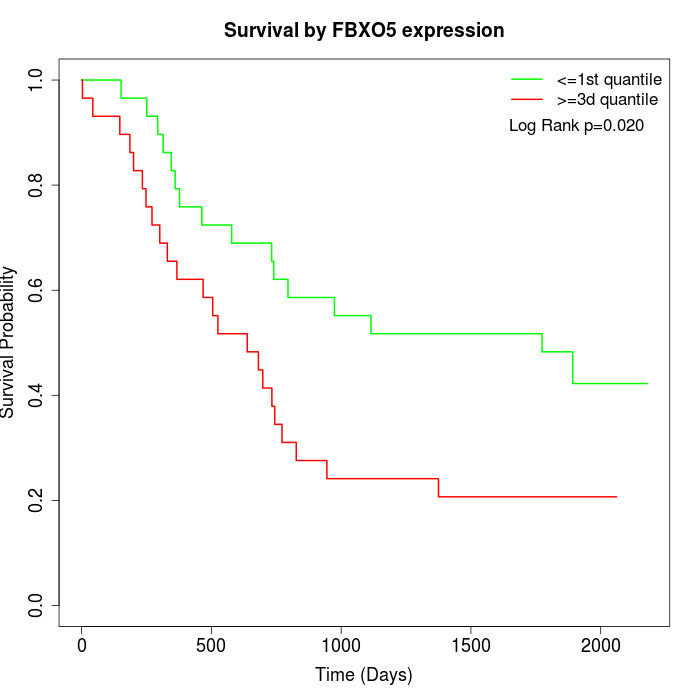 | 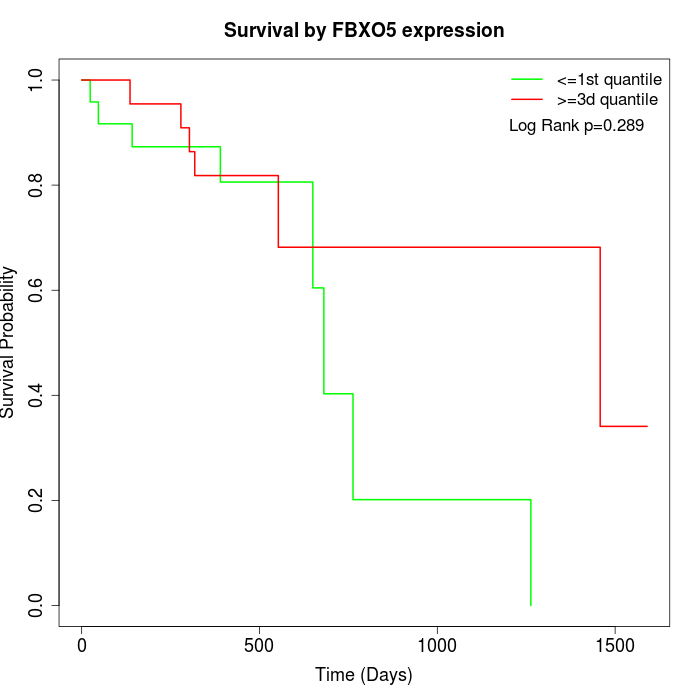 |
| GSE53622 | GSE53624 | TCGA |
Note: Click image to view full size file.
Copy number change of FBXO5:
| Dataset | Gene | EntrezID | Gain | Loss | Normal | Detail |
|---|---|---|---|---|---|---|
| GSE15526 | FBXO5 | 26271 | 1 | 4 | 25 | |
| GSE20123 | FBXO5 | 26271 | 1 | 3 | 26 | |
| GSE43470 | FBXO5 | 26271 | 4 | 0 | 39 | |
| GSE46452 | FBXO5 | 26271 | 3 | 10 | 46 | |
| GSE47630 | FBXO5 | 26271 | 9 | 4 | 27 | |
| GSE54993 | FBXO5 | 26271 | 3 | 2 | 65 | |
| GSE54994 | FBXO5 | 26271 | 8 | 8 | 37 | |
| GSE60625 | FBXO5 | 26271 | 0 | 1 | 10 | |
| GSE74703 | FBXO5 | 26271 | 4 | 0 | 32 | |
| GSE74704 | FBXO5 | 26271 | 0 | 1 | 19 | |
| TCGA | FBXO5 | 26271 | 12 | 20 | 64 |
Total number of gains: 45; Total number of losses: 53; Total Number of normals: 390.
Somatic mutations of FBXO5:
Generating mutation plots.
Highly correlated genes for FBXO5:
Showing top 20/1990 corelated genes with mean PCC>0.5.
| Gene1 | Gene2 | Mean PCC | Num. Datasets | Num. PCC<0 | Num. PCC>0.5 |
|---|---|---|---|---|---|
| FBXO5 | MMS22L | 0.841172 | 3 | 0 | 3 |
| FBXO5 | CDK1 | 0.814736 | 12 | 0 | 12 |
| FBXO5 | GMNN | 0.813836 | 12 | 0 | 12 |
| FBXO5 | CKS1B | 0.79008 | 12 | 0 | 12 |
| FBXO5 | RAD51AP1 | 0.788237 | 13 | 0 | 13 |
| FBXO5 | UBE2T | 0.783944 | 8 | 0 | 8 |
| FBXO5 | BUB1 | 0.782347 | 11 | 0 | 11 |
| FBXO5 | CKS2 | 0.780643 | 12 | 0 | 12 |
| FBXO5 | TOP2A | 0.774888 | 13 | 0 | 13 |
| FBXO5 | MAD2L1 | 0.771015 | 13 | 0 | 13 |
| FBXO5 | CEP55 | 0.770175 | 13 | 0 | 13 |
| FBXO5 | KIF2C | 0.770139 | 12 | 0 | 11 |
| FBXO5 | ATAD2 | 0.769913 | 13 | 0 | 12 |
| FBXO5 | CENPN | 0.76979 | 12 | 0 | 12 |
| FBXO5 | NUSAP1 | 0.768907 | 13 | 0 | 13 |
| FBXO5 | NEK2 | 0.767121 | 13 | 0 | 12 |
| FBXO5 | KIF23 | 0.765959 | 13 | 0 | 13 |
| FBXO5 | MCM6 | 0.765631 | 13 | 0 | 13 |
| FBXO5 | TTK | 0.761465 | 13 | 0 | 12 |
| FBXO5 | EXOC6 | 0.759908 | 3 | 0 | 3 |
For details and further investigation, click here