| Full name: mutS homolog 2 | Alias Symbol: HNPCC|HNPCC1 | ||
| Type: protein-coding gene | Cytoband: 2p21-p16.3 | ||
| Entrez ID: 4436 | HGNC ID: HGNC:7325 | Ensembl Gene: ENSG00000095002 | OMIM ID: 609309 |
| Related drugs: ATEZOLIZUMAB, DURVALUMAB, IPILIMUMAB, NIVOLUMAB, PEMBROLIZUMAB... [more] | |||
Screen Evidence:
| |||
Expression of MSH2:
| Dataset | Gene | EntrezID | Probe | Log2FC | Adj.pValue | Expression |
|---|---|---|---|---|---|---|
| GSE17351 | MSH2 | 4436 | 209421_at | 0.7441 | 0.0391 | |
| GSE20347 | MSH2 | 4436 | 209421_at | 0.9802 | 0.0020 | |
| GSE23400 | MSH2 | 4436 | 209421_at | 0.6472 | 0.0000 | |
| GSE26886 | MSH2 | 4436 | 209421_at | 0.0690 | 0.8415 | |
| GSE29001 | MSH2 | 4436 | 209421_at | 0.6976 | 0.0715 | |
| GSE38129 | MSH2 | 4436 | 209421_at | 1.0351 | 0.0000 | |
| GSE45670 | MSH2 | 4436 | 209421_at | 0.3865 | 0.1222 | |
| GSE53622 | MSH2 | 4436 | 34438 | 0.6491 | 0.0000 | |
| GSE53624 | MSH2 | 4436 | 34438 | 0.6879 | 0.0000 | |
| GSE63941 | MSH2 | 4436 | 209421_at | 1.7818 | 0.0047 | |
| GSE77861 | MSH2 | 4436 | 209421_at | 0.4645 | 0.1516 | |
| GSE97050 | MSH2 | 4436 | A_33_P3287502 | 0.3243 | 0.2808 | |
| SRP007169 | MSH2 | 4436 | RNAseq | 1.4358 | 0.0001 | |
| SRP008496 | MSH2 | 4436 | RNAseq | 1.5266 | 0.0000 | |
| SRP064894 | MSH2 | 4436 | RNAseq | 0.5330 | 0.0405 | |
| SRP133303 | MSH2 | 4436 | RNAseq | 0.5475 | 0.0001 | |
| SRP159526 | MSH2 | 4436 | RNAseq | 1.0736 | 0.0034 | |
| SRP193095 | MSH2 | 4436 | RNAseq | 0.6253 | 0.0000 | |
| SRP219564 | MSH2 | 4436 | RNAseq | 0.3234 | 0.3021 | |
| TCGA | MSH2 | 4436 | RNAseq | 0.3724 | 0.0000 |
Upregulated datasets: 5; Downregulated datasets: 0.
Survival by MSH2 expression:
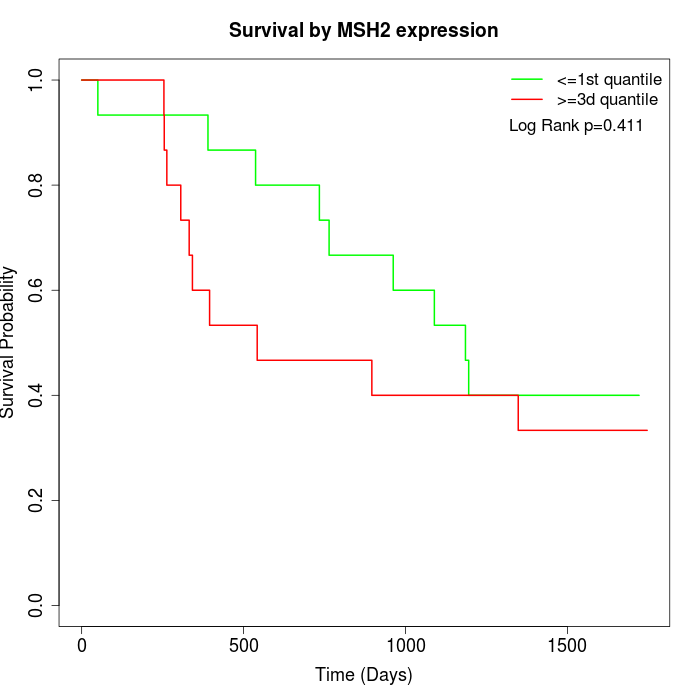 | 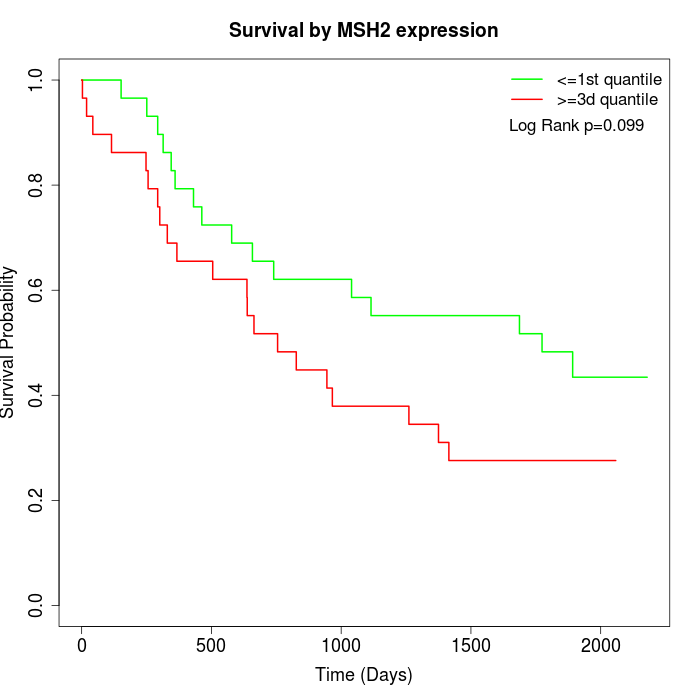 | 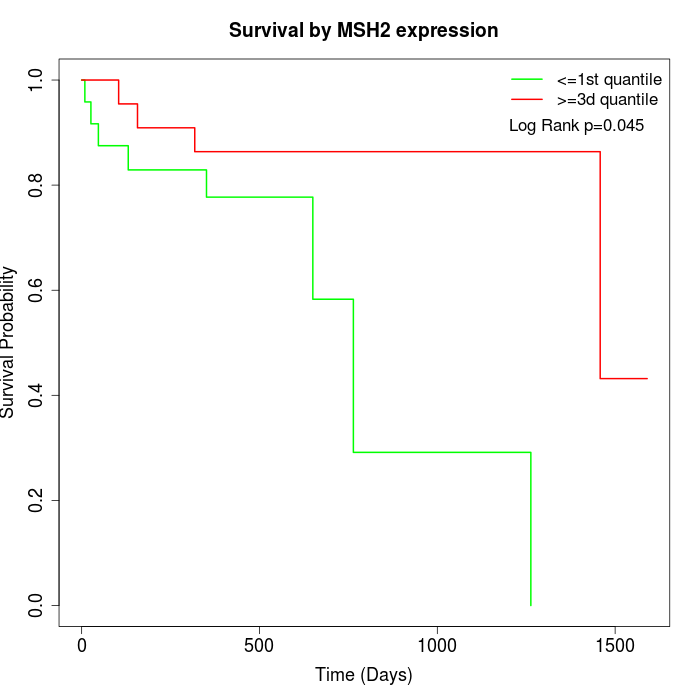 |
| GSE53622 | GSE53624 | TCGA |
Note: Click image to view full size file.
Copy number change of MSH2:
| Dataset | Gene | EntrezID | Gain | Loss | Normal | Detail |
|---|---|---|---|---|---|---|
| GSE15526 | MSH2 | 4436 | 10 | 1 | 19 | |
| GSE20123 | MSH2 | 4436 | 8 | 1 | 21 | |
| GSE43470 | MSH2 | 4436 | 5 | 0 | 38 | |
| GSE46452 | MSH2 | 4436 | 1 | 4 | 54 | |
| GSE47630 | MSH2 | 4436 | 8 | 0 | 32 | |
| GSE54993 | MSH2 | 4436 | 0 | 5 | 65 | |
| GSE54994 | MSH2 | 4436 | 12 | 0 | 41 | |
| GSE60625 | MSH2 | 4436 | 0 | 3 | 8 | |
| GSE74703 | MSH2 | 4436 | 5 | 0 | 31 | |
| GSE74704 | MSH2 | 4436 | 9 | 1 | 10 | |
| TCGA | MSH2 | 4436 | 36 | 2 | 58 |
Total number of gains: 94; Total number of losses: 17; Total Number of normals: 377.
Somatic mutations of MSH2:
Generating mutation plots.
Highly correlated genes for MSH2:
Showing top 20/1671 corelated genes with mean PCC>0.5.
| Gene1 | Gene2 | Mean PCC | Num. Datasets | Num. PCC<0 | Num. PCC>0.5 |
|---|---|---|---|---|---|
| MSH2 | MMS22L | 0.782091 | 3 | 0 | 3 |
| MSH2 | RAD18 | 0.781392 | 3 | 0 | 3 |
| MSH2 | BAP1 | 0.779338 | 3 | 0 | 3 |
| MSH2 | MSH6 | 0.777898 | 13 | 0 | 12 |
| MSH2 | ACACA | 0.773864 | 3 | 0 | 3 |
| MSH2 | ACTR2 | 0.771286 | 3 | 0 | 3 |
| MSH2 | ANAPC1 | 0.766176 | 3 | 0 | 3 |
| MSH2 | MCM6 | 0.757389 | 12 | 0 | 11 |
| MSH2 | NT5DC2 | 0.749899 | 3 | 0 | 3 |
| MSH2 | XPO1 | 0.748568 | 13 | 0 | 12 |
| MSH2 | PPP1R8 | 0.746979 | 5 | 0 | 5 |
| MSH2 | MIF | 0.744926 | 3 | 0 | 3 |
| MSH2 | AURKAIP1 | 0.744907 | 3 | 0 | 3 |
| MSH2 | GMNN | 0.740729 | 12 | 0 | 11 |
| MSH2 | RNF26 | 0.739235 | 3 | 0 | 3 |
| MSH2 | ORAI1 | 0.732996 | 5 | 0 | 4 |
| MSH2 | CCT4 | 0.731713 | 12 | 0 | 12 |
| MSH2 | ARHGEF19 | 0.730009 | 4 | 0 | 4 |
| MSH2 | CENPA | 0.72936 | 11 | 0 | 11 |
| MSH2 | MRPL38 | 0.728518 | 3 | 0 | 3 |
For details and further investigation, click here