| Full name: potassium channel tetramerization domain containing 5 | Alias Symbol: FLJ20040 | ||
| Type: protein-coding gene | Cytoband: 16p13.3 | ||
| Entrez ID: 54442 | HGNC ID: HGNC:21423 | Ensembl Gene: ENSG00000167977 | OMIM ID: 611285 |
Screen Evidence:
| |||
Expression of KCTD5:
| Dataset | Gene | EntrezID | Probe | Log2FC | Adj.pValue | Expression |
|---|---|---|---|---|---|---|
| GSE17351 | KCTD5 | 54442 | 218474_s_at | 0.3457 | 0.6408 | |
| GSE20347 | KCTD5 | 54442 | 218474_s_at | -0.2099 | 0.1666 | |
| GSE23400 | KCTD5 | 54442 | 218474_s_at | 0.1806 | 0.0621 | |
| GSE26886 | KCTD5 | 54442 | 218474_s_at | -1.1003 | 0.0000 | |
| GSE29001 | KCTD5 | 54442 | 218474_s_at | -0.0408 | 0.9110 | |
| GSE38129 | KCTD5 | 54442 | 218474_s_at | 0.1905 | 0.3260 | |
| GSE45670 | KCTD5 | 54442 | 218474_s_at | 0.3460 | 0.0288 | |
| GSE53622 | KCTD5 | 54442 | 133118 | -0.0652 | 0.5832 | |
| GSE53624 | KCTD5 | 54442 | 133118 | -0.0905 | 0.2961 | |
| GSE63941 | KCTD5 | 54442 | 218474_s_at | 0.5651 | 0.0571 | |
| GSE77861 | KCTD5 | 54442 | 218474_s_at | -0.0653 | 0.8531 | |
| GSE97050 | KCTD5 | 54442 | A_33_P3362981 | 0.3898 | 0.3557 | |
| SRP007169 | KCTD5 | 54442 | RNAseq | -1.0937 | 0.0007 | |
| SRP008496 | KCTD5 | 54442 | RNAseq | -1.0093 | 0.0000 | |
| SRP064894 | KCTD5 | 54442 | RNAseq | -0.3406 | 0.0869 | |
| SRP133303 | KCTD5 | 54442 | RNAseq | 0.3157 | 0.0727 | |
| SRP159526 | KCTD5 | 54442 | RNAseq | -0.2862 | 0.4030 | |
| SRP193095 | KCTD5 | 54442 | RNAseq | -0.3400 | 0.0085 | |
| SRP219564 | KCTD5 | 54442 | RNAseq | -0.3323 | 0.4456 | |
| TCGA | KCTD5 | 54442 | RNAseq | 0.2135 | 0.0002 |
Upregulated datasets: 0; Downregulated datasets: 3.
Survival by KCTD5 expression:
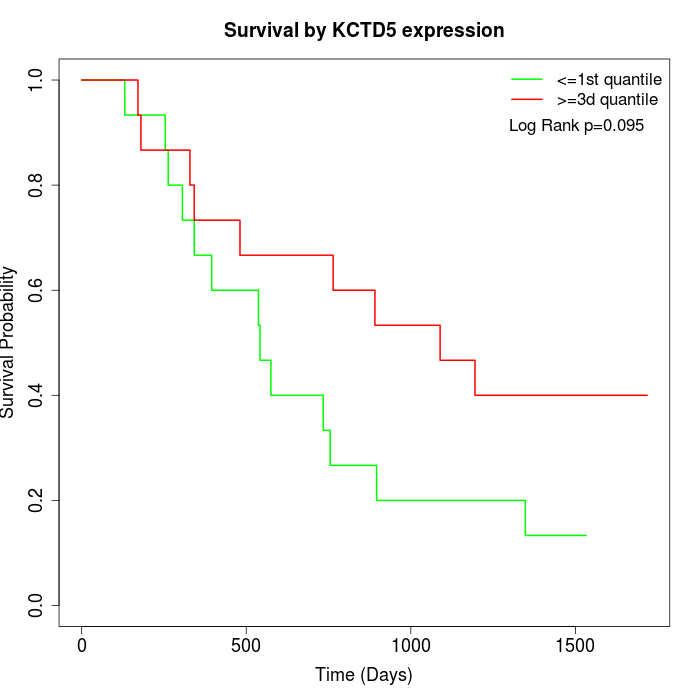 | 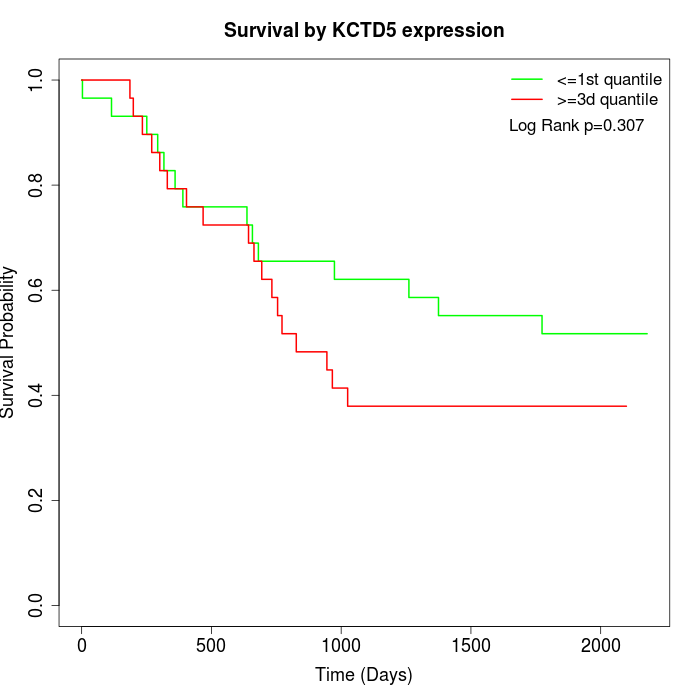 | 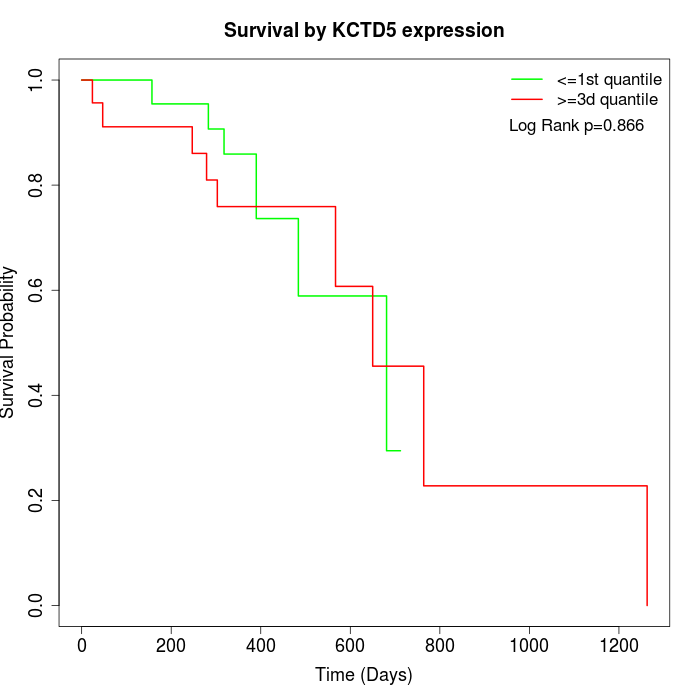 |
| GSE53622 | GSE53624 | TCGA |
Note: Click image to view full size file.
Copy number change of KCTD5:
| Dataset | Gene | EntrezID | Gain | Loss | Normal | Detail |
|---|---|---|---|---|---|---|
| GSE15526 | KCTD5 | 54442 | 5 | 5 | 20 | |
| GSE20123 | KCTD5 | 54442 | 5 | 4 | 21 | |
| GSE43470 | KCTD5 | 54442 | 4 | 7 | 32 | |
| GSE46452 | KCTD5 | 54442 | 38 | 1 | 20 | |
| GSE47630 | KCTD5 | 54442 | 13 | 6 | 21 | |
| GSE54993 | KCTD5 | 54442 | 3 | 5 | 62 | |
| GSE54994 | KCTD5 | 54442 | 5 | 9 | 39 | |
| GSE60625 | KCTD5 | 54442 | 4 | 0 | 7 | |
| GSE74703 | KCTD5 | 54442 | 4 | 5 | 27 | |
| GSE74704 | KCTD5 | 54442 | 3 | 2 | 15 | |
| TCGA | KCTD5 | 54442 | 19 | 13 | 64 |
Total number of gains: 103; Total number of losses: 57; Total Number of normals: 328.
Somatic mutations of KCTD5:
Generating mutation plots.
Highly correlated genes for KCTD5:
Showing top 20/344 corelated genes with mean PCC>0.5.
| Gene1 | Gene2 | Mean PCC | Num. Datasets | Num. PCC<0 | Num. PCC>0.5 |
|---|---|---|---|---|---|
| KCTD5 | SGPP2 | 0.700993 | 4 | 0 | 4 |
| KCTD5 | CROT | 0.684073 | 3 | 0 | 3 |
| KCTD5 | NUDT16L1 | 0.683592 | 4 | 0 | 3 |
| KCTD5 | PPP4C | 0.68287 | 12 | 0 | 11 |
| KCTD5 | PAFAH2 | 0.675824 | 4 | 0 | 3 |
| KCTD5 | C6orf132 | 0.669938 | 4 | 0 | 3 |
| KCTD5 | SEC13 | 0.666284 | 5 | 0 | 4 |
| KCTD5 | FAM83C | 0.663036 | 5 | 0 | 4 |
| KCTD5 | NUBP2 | 0.660359 | 4 | 0 | 3 |
| KCTD5 | CNOT11 | 0.655398 | 5 | 0 | 4 |
| KCTD5 | CC2D1B | 0.652367 | 4 | 0 | 3 |
| KCTD5 | MAP3K9 | 0.648955 | 7 | 0 | 5 |
| KCTD5 | GPR157 | 0.64749 | 4 | 0 | 4 |
| KCTD5 | TMEM125 | 0.646369 | 4 | 0 | 3 |
| KCTD5 | AMFR | 0.641709 | 4 | 0 | 4 |
| KCTD5 | CNEP1R1 | 0.640932 | 4 | 0 | 3 |
| KCTD5 | DAPP1 | 0.636622 | 4 | 0 | 3 |
| KCTD5 | SLC11A2 | 0.631837 | 4 | 0 | 3 |
| KCTD5 | SMAGP | 0.630174 | 4 | 0 | 3 |
| KCTD5 | AKR7A3 | 0.628947 | 4 | 0 | 3 |
For details and further investigation, click here