| Full name: CTD nuclear envelope phosphatase 1 regulatory subunit 1 | Alias Symbol: FLJ38101|NEP1-R1 | ||
| Type: protein-coding gene | Cytoband: 16q12.1 | ||
| Entrez ID: 255919 | HGNC ID: HGNC:26759 | Ensembl Gene: ENSG00000205423 | OMIM ID: 616869 |
Screen Evidence:
| |||
Expression of CNEP1R1:
| Dataset | Gene | EntrezID | Probe | Log2FC | Adj.pValue | Expression |
|---|---|---|---|---|---|---|
| GSE17351 | CNEP1R1 | 255919 | 235812_at | -0.2305 | 0.7045 | |
| GSE26886 | CNEP1R1 | 255919 | 235812_at | -1.5624 | 0.0000 | |
| GSE45670 | CNEP1R1 | 255919 | 235812_at | -0.1219 | 0.2965 | |
| GSE53622 | CNEP1R1 | 255919 | 54310 | -0.0976 | 0.2078 | |
| GSE53624 | CNEP1R1 | 255919 | 54310 | -0.2964 | 0.0000 | |
| GSE63941 | CNEP1R1 | 255919 | 235812_at | -0.9456 | 0.0091 | |
| GSE77861 | CNEP1R1 | 255919 | 235812_at | -0.2856 | 0.1903 | |
| SRP007169 | CNEP1R1 | 255919 | RNAseq | -1.6733 | 0.0000 | |
| SRP008496 | CNEP1R1 | 255919 | RNAseq | -1.3630 | 0.0000 | |
| SRP064894 | CNEP1R1 | 255919 | RNAseq | -0.4513 | 0.0071 | |
| SRP133303 | CNEP1R1 | 255919 | RNAseq | 0.1326 | 0.3895 | |
| SRP159526 | CNEP1R1 | 255919 | RNAseq | -0.4796 | 0.0393 | |
| SRP193095 | CNEP1R1 | 255919 | RNAseq | -0.5356 | 0.0000 | |
| SRP219564 | CNEP1R1 | 255919 | RNAseq | -0.6318 | 0.0669 |
Upregulated datasets: 0; Downregulated datasets: 3.
Survival by CNEP1R1 expression:
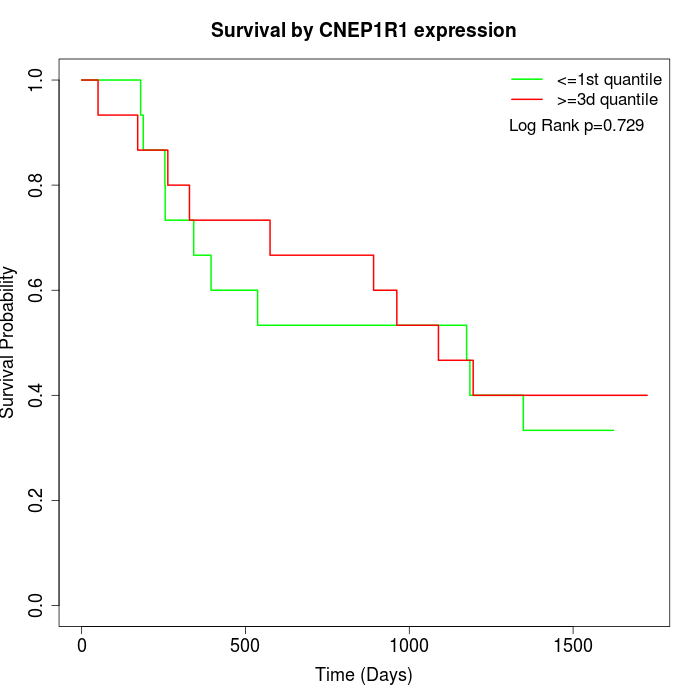 | 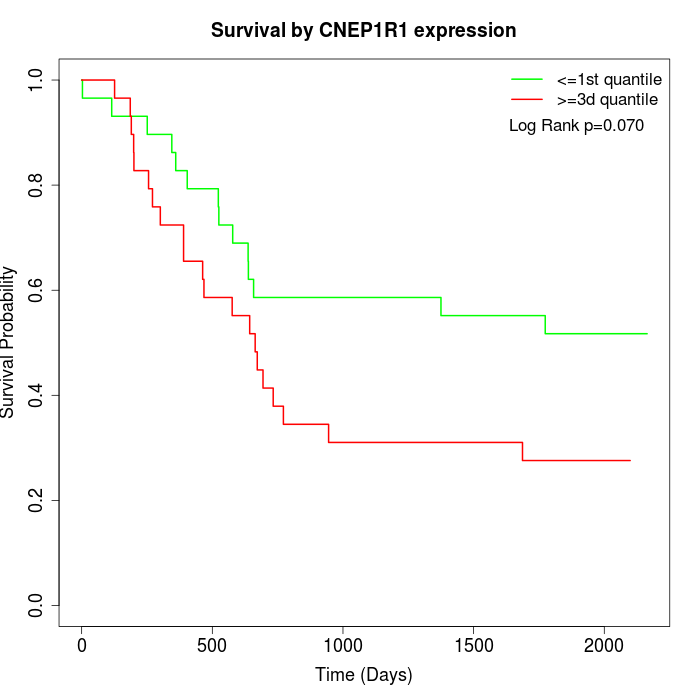 |
| GSE53622 | GSE53624 |
Note: Click image to view full size file.
Copy number change of CNEP1R1:
| Dataset | Gene | EntrezID | Gain | Loss | Normal | Detail |
|---|---|---|---|---|---|---|
| GSE15526 | CNEP1R1 | 255919 | 4 | 1 | 25 | |
| GSE20123 | CNEP1R1 | 255919 | 3 | 1 | 26 | |
| GSE43470 | CNEP1R1 | 255919 | 2 | 7 | 34 | |
| GSE46452 | CNEP1R1 | 255919 | 38 | 1 | 20 | |
| GSE47630 | CNEP1R1 | 255919 | 11 | 7 | 22 | |
| GSE54993 | CNEP1R1 | 255919 | 2 | 5 | 63 | |
| GSE54994 | CNEP1R1 | 255919 | 6 | 10 | 37 | |
| GSE60625 | CNEP1R1 | 255919 | 4 | 0 | 7 | |
| GSE74703 | CNEP1R1 | 255919 | 2 | 4 | 30 | |
| GSE74704 | CNEP1R1 | 255919 | 3 | 1 | 16 | |
| TCGA | CNEP1R1 | 255919 | 25 | 12 | 59 |
Total number of gains: 100; Total number of losses: 49; Total Number of normals: 339.
Somatic mutations of CNEP1R1:
Generating mutation plots.
Highly correlated genes for CNEP1R1:
Showing top 20/530 corelated genes with mean PCC>0.5.
| Gene1 | Gene2 | Mean PCC | Num. Datasets | Num. PCC<0 | Num. PCC>0.5 |
|---|---|---|---|---|---|
| CNEP1R1 | TRIP12 | 0.721095 | 4 | 0 | 4 |
| CNEP1R1 | SH3PXD2A-AS1 | 0.717092 | 3 | 0 | 3 |
| CNEP1R1 | LYSMD3 | 0.714084 | 5 | 0 | 5 |
| CNEP1R1 | DSG1 | 0.710729 | 3 | 0 | 3 |
| CNEP1R1 | ACTR2 | 0.699688 | 3 | 0 | 3 |
| CNEP1R1 | KCMF1 | 0.696423 | 3 | 0 | 3 |
| CNEP1R1 | PRSS2 | 0.695462 | 4 | 0 | 3 |
| CNEP1R1 | HCAR3 | 0.690752 | 4 | 0 | 3 |
| CNEP1R1 | THAP2 | 0.689862 | 4 | 0 | 4 |
| CNEP1R1 | PKN2 | 0.687133 | 4 | 0 | 3 |
| CNEP1R1 | ATP6V1D | 0.683902 | 4 | 0 | 4 |
| CNEP1R1 | SLC10A7 | 0.677058 | 4 | 0 | 4 |
| CNEP1R1 | IL22RA1 | 0.67489 | 4 | 0 | 3 |
| CNEP1R1 | YIPF5 | 0.670555 | 4 | 0 | 3 |
| CNEP1R1 | ORMDL2 | 0.670023 | 4 | 0 | 3 |
| CNEP1R1 | GFOD2 | 0.669878 | 4 | 0 | 3 |
| CNEP1R1 | UBE2J1 | 0.669736 | 4 | 0 | 4 |
| CNEP1R1 | CES2 | 0.667207 | 4 | 0 | 4 |
| CNEP1R1 | ESYT2 | 0.665227 | 3 | 0 | 3 |
| CNEP1R1 | CARHSP1 | 0.664946 | 5 | 0 | 4 |
For details and further investigation, click here