| Full name: KH RNA binding domain containing, signal transduction associated 3 | Alias Symbol: T-STAR|Etle|etoile|SALP|SLM2|SLM-2 | ||
| Type: protein-coding gene | Cytoband: 8q24.23 | ||
| Entrez ID: 10656 | HGNC ID: HGNC:18117 | Ensembl Gene: ENSG00000131773 | OMIM ID: 610421 |
Expression of KHDRBS3:
| Dataset | Gene | EntrezID | Probe | Log2FC | Adj.pValue | Expression |
|---|---|---|---|---|---|---|
| GSE17351 | KHDRBS3 | 10656 | 209781_s_at | -0.1318 | 0.9431 | |
| GSE20347 | KHDRBS3 | 10656 | 209781_s_at | 0.4779 | 0.0610 | |
| GSE23400 | KHDRBS3 | 10656 | 209781_s_at | -0.0028 | 0.9739 | |
| GSE26886 | KHDRBS3 | 10656 | 209781_s_at | 1.1977 | 0.0055 | |
| GSE29001 | KHDRBS3 | 10656 | 209781_s_at | 0.1295 | 0.7708 | |
| GSE38129 | KHDRBS3 | 10656 | 209781_s_at | 0.0164 | 0.9599 | |
| GSE45670 | KHDRBS3 | 10656 | 209781_s_at | -0.1695 | 0.6998 | |
| GSE53622 | KHDRBS3 | 10656 | 77761 | 0.3393 | 0.0303 | |
| GSE53624 | KHDRBS3 | 10656 | 77761 | 0.3352 | 0.0148 | |
| GSE63941 | KHDRBS3 | 10656 | 209781_s_at | -2.5203 | 0.0168 | |
| GSE77861 | KHDRBS3 | 10656 | 209781_s_at | 0.5242 | 0.1593 | |
| GSE97050 | KHDRBS3 | 10656 | A_33_P3394727 | -0.1524 | 0.7653 | |
| SRP064894 | KHDRBS3 | 10656 | RNAseq | 0.1797 | 0.5688 | |
| SRP133303 | KHDRBS3 | 10656 | RNAseq | 0.7775 | 0.0064 | |
| SRP159526 | KHDRBS3 | 10656 | RNAseq | 2.1479 | 0.0112 | |
| SRP193095 | KHDRBS3 | 10656 | RNAseq | 0.9298 | 0.0007 | |
| SRP219564 | KHDRBS3 | 10656 | RNAseq | 0.1086 | 0.8969 | |
| TCGA | KHDRBS3 | 10656 | RNAseq | -0.2089 | 0.3180 |
Upregulated datasets: 2; Downregulated datasets: 1.
Survival by KHDRBS3 expression:
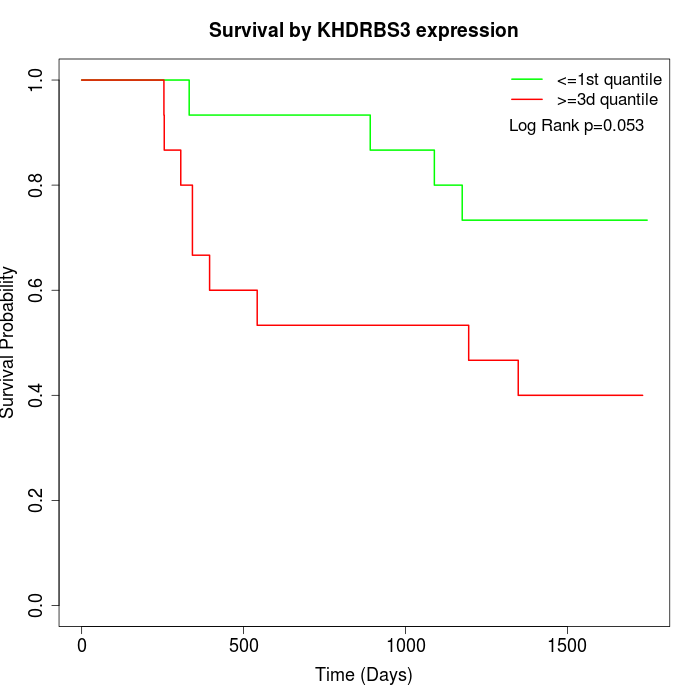 | 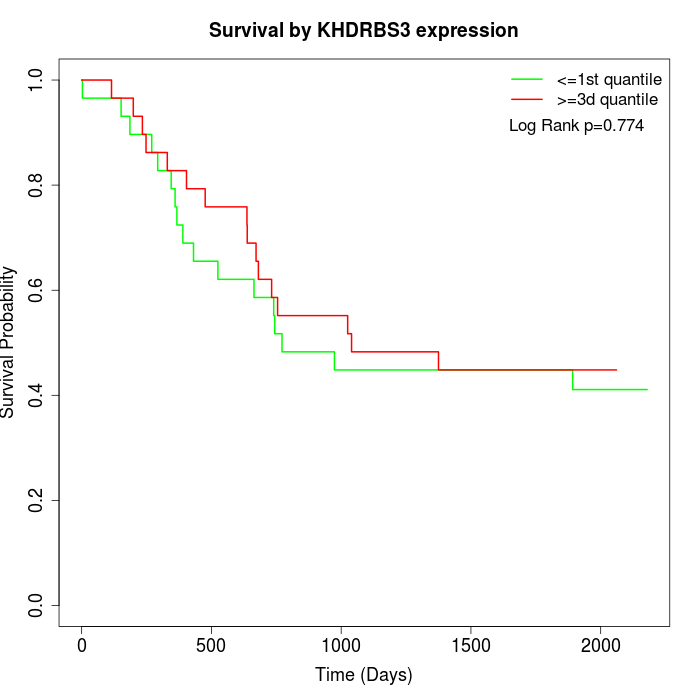 | 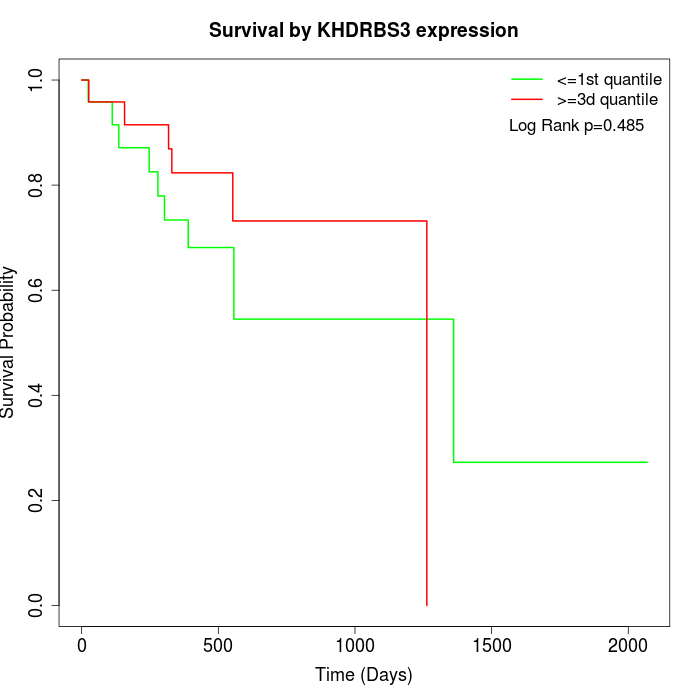 |
| GSE53622 | GSE53624 | TCGA |
Note: Click image to view full size file.
Copy number change of KHDRBS3:
| Dataset | Gene | EntrezID | Gain | Loss | Normal | Detail |
|---|---|---|---|---|---|---|
| GSE15526 | KHDRBS3 | 10656 | 16 | 1 | 13 | |
| GSE20123 | KHDRBS3 | 10656 | 16 | 1 | 13 | |
| GSE43470 | KHDRBS3 | 10656 | 23 | 1 | 19 | |
| GSE46452 | KHDRBS3 | 10656 | 27 | 0 | 32 | |
| GSE47630 | KHDRBS3 | 10656 | 24 | 0 | 16 | |
| GSE54993 | KHDRBS3 | 10656 | 0 | 25 | 45 | |
| GSE54994 | KHDRBS3 | 10656 | 39 | 1 | 13 | |
| GSE60625 | KHDRBS3 | 10656 | 0 | 7 | 4 | |
| GSE74703 | KHDRBS3 | 10656 | 20 | 0 | 16 | |
| GSE74704 | KHDRBS3 | 10656 | 11 | 1 | 8 | |
| TCGA | KHDRBS3 | 10656 | 65 | 2 | 29 |
Total number of gains: 241; Total number of losses: 39; Total Number of normals: 208.
Somatic mutations of KHDRBS3:
Generating mutation plots.
Highly correlated genes for KHDRBS3:
Showing top 20/190 corelated genes with mean PCC>0.5.
| Gene1 | Gene2 | Mean PCC | Num. Datasets | Num. PCC<0 | Num. PCC>0.5 |
|---|---|---|---|---|---|
| KHDRBS3 | LINC00667 | 0.686821 | 3 | 0 | 3 |
| KHDRBS3 | FAM219A | 0.640322 | 3 | 0 | 3 |
| KHDRBS3 | OSR1 | 0.631948 | 4 | 0 | 3 |
| KHDRBS3 | PLIN2 | 0.62408 | 4 | 0 | 3 |
| KHDRBS3 | KIF7 | 0.616789 | 4 | 0 | 3 |
| KHDRBS3 | S1PR3 | 0.615668 | 5 | 0 | 4 |
| KHDRBS3 | IMPAD1 | 0.613413 | 4 | 0 | 3 |
| KHDRBS3 | SDC2 | 0.607333 | 7 | 0 | 6 |
| KHDRBS3 | DACT3 | 0.604951 | 4 | 0 | 3 |
| KHDRBS3 | C11orf96 | 0.602174 | 4 | 0 | 3 |
| KHDRBS3 | CSPG4 | 0.600198 | 8 | 0 | 5 |
| KHDRBS3 | ENKD1 | 0.593826 | 3 | 0 | 3 |
| KHDRBS3 | SLC39A13 | 0.593471 | 4 | 0 | 3 |
| KHDRBS3 | PELI2 | 0.593375 | 4 | 0 | 3 |
| KHDRBS3 | HSD11B1 | 0.592495 | 6 | 0 | 4 |
| KHDRBS3 | CXCL5 | 0.581491 | 4 | 0 | 3 |
| KHDRBS3 | SGIP1 | 0.581134 | 4 | 0 | 3 |
| KHDRBS3 | NLGN2 | 0.577022 | 3 | 0 | 3 |
| KHDRBS3 | ARHGEF2 | 0.576816 | 5 | 0 | 4 |
| KHDRBS3 | FAT4 | 0.575936 | 5 | 0 | 5 |
For details and further investigation, click here