| Full name: leucine rich repeats and immunoglobulin like domains 1 | Alias Symbol: LIG-1|DKFZP586O1624|LIG1 | ||
| Type: protein-coding gene | Cytoband: 3p14.1 | ||
| Entrez ID: 26018 | HGNC ID: HGNC:17360 | Ensembl Gene: ENSG00000144749 | OMIM ID: 608868 |
Expression of LRIG1:
| Dataset | Gene | EntrezID | Probe | Log2FC | Adj.pValue | Expression |
|---|---|---|---|---|---|---|
| GSE17351 | LRIG1 | 26018 | 211596_s_at | -0.0217 | 0.9888 | |
| GSE20347 | LRIG1 | 26018 | 211596_s_at | 0.2165 | 0.4993 | |
| GSE23400 | LRIG1 | 26018 | 211596_s_at | 0.3029 | 0.0678 | |
| GSE26886 | LRIG1 | 26018 | 211596_s_at | 0.6383 | 0.2678 | |
| GSE29001 | LRIG1 | 26018 | 211596_s_at | 0.3285 | 0.6098 | |
| GSE38129 | LRIG1 | 26018 | 211596_s_at | 0.0074 | 0.9856 | |
| GSE45670 | LRIG1 | 26018 | 211596_s_at | -1.0198 | 0.0210 | |
| GSE53622 | LRIG1 | 26018 | 157622 | -0.0599 | 0.5001 | |
| GSE53624 | LRIG1 | 26018 | 157622 | 0.1060 | 0.1058 | |
| GSE63941 | LRIG1 | 26018 | 211596_s_at | -1.6802 | 0.2687 | |
| GSE77861 | LRIG1 | 26018 | 211596_s_at | 0.7547 | 0.0766 | |
| GSE97050 | LRIG1 | 26018 | A_23_P109636 | -0.1868 | 0.5124 | |
| SRP007169 | LRIG1 | 26018 | RNAseq | 1.0879 | 0.0694 | |
| SRP008496 | LRIG1 | 26018 | RNAseq | 1.2782 | 0.0008 | |
| SRP064894 | LRIG1 | 26018 | RNAseq | 0.0540 | 0.8244 | |
| SRP133303 | LRIG1 | 26018 | RNAseq | -0.1852 | 0.4827 | |
| SRP159526 | LRIG1 | 26018 | RNAseq | 0.4430 | 0.0669 | |
| SRP193095 | LRIG1 | 26018 | RNAseq | -0.0754 | 0.7382 | |
| SRP219564 | LRIG1 | 26018 | RNAseq | -0.0716 | 0.9310 | |
| TCGA | LRIG1 | 26018 | RNAseq | -0.6203 | 0.0000 |
Upregulated datasets: 1; Downregulated datasets: 1.
Survival by LRIG1 expression:
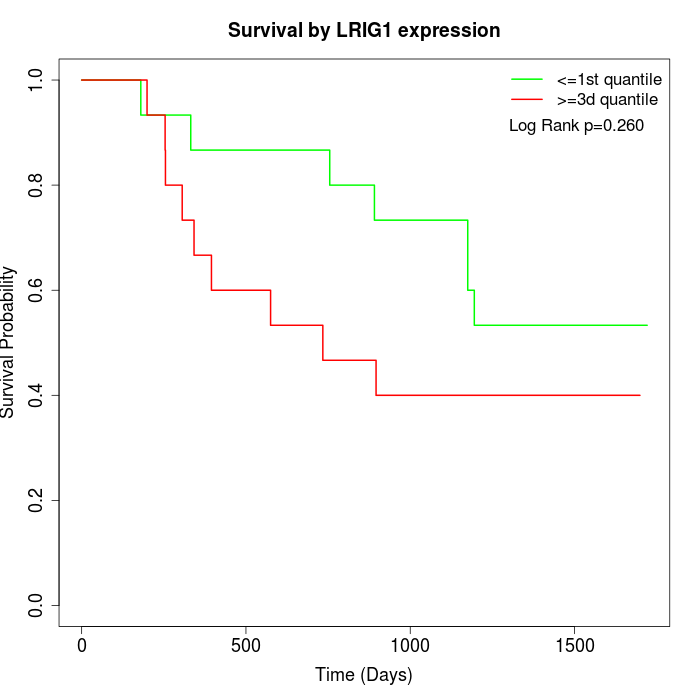 | 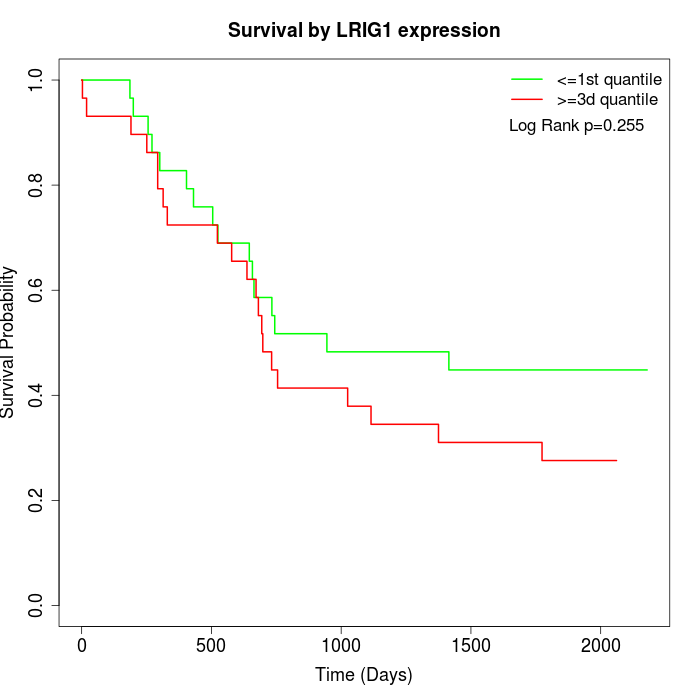 | 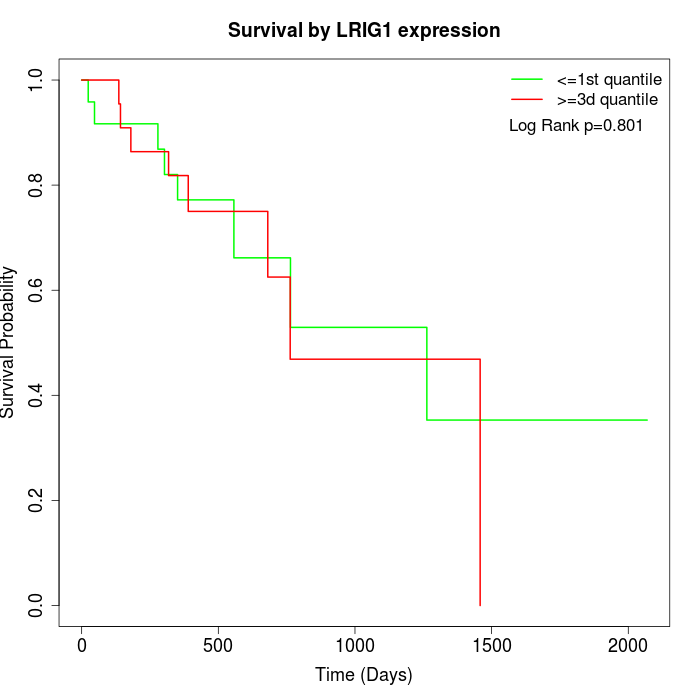 |
| GSE53622 | GSE53624 | TCGA |
Note: Click image to view full size file.
Copy number change of LRIG1:
| Dataset | Gene | EntrezID | Gain | Loss | Normal | Detail |
|---|---|---|---|---|---|---|
| GSE15526 | LRIG1 | 26018 | 1 | 18 | 11 | |
| GSE20123 | LRIG1 | 26018 | 1 | 18 | 11 | |
| GSE43470 | LRIG1 | 26018 | 0 | 20 | 23 | |
| GSE46452 | LRIG1 | 26018 | 2 | 17 | 40 | |
| GSE47630 | LRIG1 | 26018 | 2 | 23 | 15 | |
| GSE54993 | LRIG1 | 26018 | 5 | 2 | 63 | |
| GSE54994 | LRIG1 | 26018 | 1 | 33 | 19 | |
| GSE60625 | LRIG1 | 26018 | 3 | 1 | 7 | |
| GSE74703 | LRIG1 | 26018 | 0 | 16 | 20 | |
| GSE74704 | LRIG1 | 26018 | 1 | 12 | 7 | |
| TCGA | LRIG1 | 26018 | 0 | 78 | 18 |
Total number of gains: 16; Total number of losses: 238; Total Number of normals: 234.
Somatic mutations of LRIG1:
Generating mutation plots.
Highly correlated genes for LRIG1:
Showing top 20/461 corelated genes with mean PCC>0.5.
| Gene1 | Gene2 | Mean PCC | Num. Datasets | Num. PCC<0 | Num. PCC>0.5 |
|---|---|---|---|---|---|
| LRIG1 | ARHGEF9 | 0.701831 | 4 | 0 | 4 |
| LRIG1 | FAM200B | 0.677298 | 3 | 0 | 3 |
| LRIG1 | LINC01234 | 0.671551 | 3 | 0 | 3 |
| LRIG1 | ZER1 | 0.660641 | 3 | 0 | 3 |
| LRIG1 | FGFR2 | 0.641164 | 6 | 0 | 6 |
| LRIG1 | VEZF1 | 0.639371 | 10 | 0 | 8 |
| LRIG1 | PKD2 | 0.637463 | 12 | 0 | 9 |
| LRIG1 | PLD3 | 0.636922 | 3 | 0 | 3 |
| LRIG1 | MLLT6 | 0.62736 | 3 | 0 | 3 |
| LRIG1 | FZD7 | 0.621266 | 12 | 0 | 9 |
| LRIG1 | PI4KA | 0.619632 | 7 | 0 | 7 |
| LRIG1 | LSM14A | 0.61888 | 4 | 0 | 3 |
| LRIG1 | SRF | 0.618136 | 6 | 0 | 4 |
| LRIG1 | PRKAG2-AS1 | 0.616256 | 3 | 0 | 3 |
| LRIG1 | LINC01278 | 0.615274 | 4 | 0 | 3 |
| LRIG1 | C3orf70 | 0.614471 | 5 | 0 | 4 |
| LRIG1 | CREB3 | 0.613427 | 4 | 0 | 4 |
| LRIG1 | ZBTB18 | 0.613115 | 9 | 0 | 7 |
| LRIG1 | FOXP2 | 0.612435 | 3 | 0 | 3 |
| LRIG1 | KIAA1841 | 0.611002 | 3 | 0 | 3 |
For details and further investigation, click here