| Full name: latent transforming growth factor beta binding protein 2 | Alias Symbol: | ||
| Type: protein-coding gene | Cytoband: 14q24.3 | ||
| Entrez ID: 4053 | HGNC ID: HGNC:6715 | Ensembl Gene: ENSG00000119681 | OMIM ID: 602091 |
Expression of LTBP2:
| Dataset | Gene | EntrezID | Probe | Log2FC | Adj.pValue | Expression |
|---|---|---|---|---|---|---|
| GSE17351 | LTBP2 | 4053 | 204682_at | -0.0036 | 0.9966 | |
| GSE20347 | LTBP2 | 4053 | 204682_at | 0.2881 | 0.0790 | |
| GSE23400 | LTBP2 | 4053 | 204682_at | 0.4832 | 0.0000 | |
| GSE26886 | LTBP2 | 4053 | 204682_at | 1.8380 | 0.0000 | |
| GSE29001 | LTBP2 | 4053 | 204682_at | 0.8163 | 0.0119 | |
| GSE38129 | LTBP2 | 4053 | 204682_at | 0.1733 | 0.4914 | |
| GSE45670 | LTBP2 | 4053 | 204682_at | -0.3734 | 0.2859 | |
| GSE53622 | LTBP2 | 4053 | 107059 | 0.5155 | 0.0000 | |
| GSE53624 | LTBP2 | 4053 | 107059 | 0.1816 | 0.0935 | |
| GSE63941 | LTBP2 | 4053 | 204682_at | -4.3687 | 0.0002 | |
| GSE77861 | LTBP2 | 4053 | 223690_at | -0.1314 | 0.7838 | |
| GSE97050 | LTBP2 | 4053 | A_23_P405129 | 0.5058 | 0.2525 | |
| SRP007169 | LTBP2 | 4053 | RNAseq | 1.9986 | 0.0001 | |
| SRP008496 | LTBP2 | 4053 | RNAseq | 2.3058 | 0.0000 | |
| SRP064894 | LTBP2 | 4053 | RNAseq | 0.8267 | 0.0003 | |
| SRP133303 | LTBP2 | 4053 | RNAseq | 0.5125 | 0.0373 | |
| SRP159526 | LTBP2 | 4053 | RNAseq | 0.7067 | 0.0203 | |
| SRP193095 | LTBP2 | 4053 | RNAseq | 0.6901 | 0.0001 | |
| SRP219564 | LTBP2 | 4053 | RNAseq | 0.6629 | 0.0841 | |
| TCGA | LTBP2 | 4053 | RNAseq | 0.0819 | 0.3369 |
Upregulated datasets: 3; Downregulated datasets: 1.
Survival by LTBP2 expression:
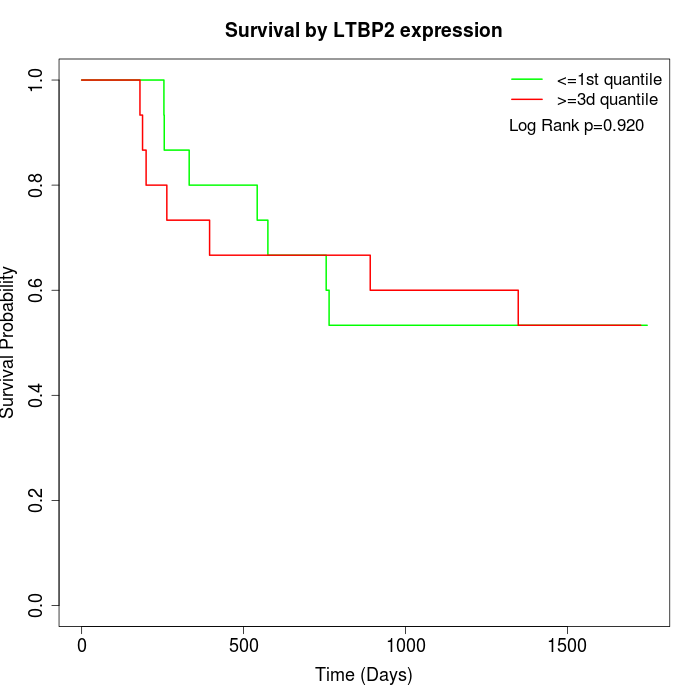 | 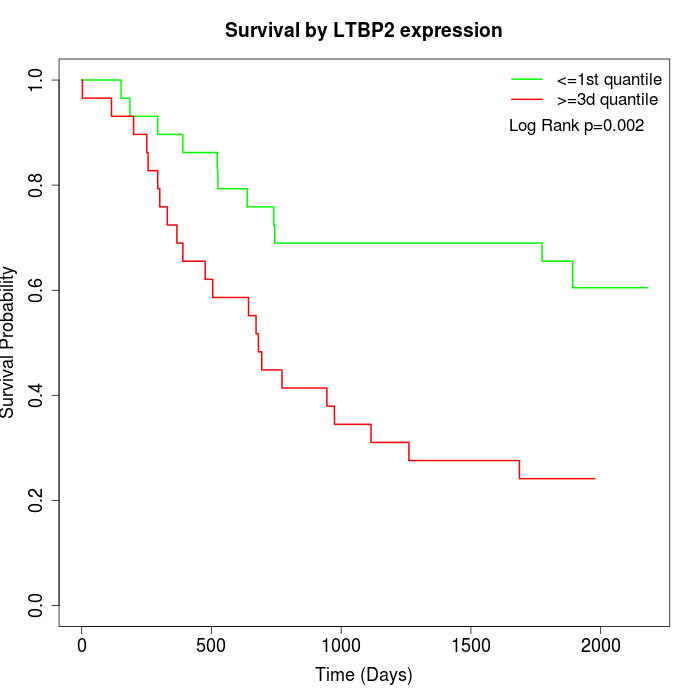 |  |
| GSE53622 | GSE53624 | TCGA |
Note: Click image to view full size file.
Copy number change of LTBP2:
| Dataset | Gene | EntrezID | Gain | Loss | Normal | Detail |
|---|---|---|---|---|---|---|
| GSE15526 | LTBP2 | 4053 | 8 | 3 | 19 | |
| GSE20123 | LTBP2 | 4053 | 8 | 3 | 19 | |
| GSE43470 | LTBP2 | 4053 | 8 | 3 | 32 | |
| GSE46452 | LTBP2 | 4053 | 16 | 3 | 40 | |
| GSE47630 | LTBP2 | 4053 | 11 | 8 | 21 | |
| GSE54993 | LTBP2 | 4053 | 3 | 8 | 59 | |
| GSE54994 | LTBP2 | 4053 | 19 | 4 | 30 | |
| GSE60625 | LTBP2 | 4053 | 0 | 2 | 9 | |
| GSE74703 | LTBP2 | 4053 | 7 | 3 | 26 | |
| GSE74704 | LTBP2 | 4053 | 3 | 3 | 14 | |
| TCGA | LTBP2 | 4053 | 32 | 16 | 48 |
Total number of gains: 115; Total number of losses: 56; Total Number of normals: 317.
Somatic mutations of LTBP2:
Generating mutation plots.
Highly correlated genes for LTBP2:
Showing top 20/1015 corelated genes with mean PCC>0.5.
| Gene1 | Gene2 | Mean PCC | Num. Datasets | Num. PCC<0 | Num. PCC>0.5 |
|---|---|---|---|---|---|
| LTBP2 | STOML1 | 0.751448 | 3 | 0 | 3 |
| LTBP2 | IGFBP5 | 0.749449 | 3 | 0 | 3 |
| LTBP2 | SNX18 | 0.743687 | 3 | 0 | 3 |
| LTBP2 | KPNA6 | 0.740103 | 3 | 0 | 3 |
| LTBP2 | C11orf96 | 0.733431 | 4 | 0 | 4 |
| LTBP2 | DHX37 | 0.727863 | 3 | 0 | 3 |
| LTBP2 | VASP | 0.721902 | 4 | 0 | 4 |
| LTBP2 | SH3RF3 | 0.721334 | 5 | 0 | 5 |
| LTBP2 | ZNF358 | 0.720823 | 3 | 0 | 3 |
| LTBP2 | SSBP4 | 0.720772 | 3 | 0 | 3 |
| LTBP2 | NACC2 | 0.720716 | 3 | 0 | 3 |
| LTBP2 | PHF11 | 0.716989 | 3 | 0 | 3 |
| LTBP2 | TK2 | 0.711272 | 4 | 0 | 4 |
| LTBP2 | CXCL5 | 0.711081 | 4 | 0 | 3 |
| LTBP2 | S1PR1 | 0.707644 | 4 | 0 | 4 |
| LTBP2 | DYNC1I2 | 0.703301 | 3 | 0 | 3 |
| LTBP2 | GALNT10 | 0.702337 | 10 | 0 | 10 |
| LTBP2 | CYB5R3 | 0.698809 | 6 | 0 | 6 |
| LTBP2 | MARK4 | 0.697665 | 4 | 0 | 4 |
| LTBP2 | PFKP | 0.69715 | 3 | 0 | 3 |
For details and further investigation, click here