| Full name: lactotransferrin | Alias Symbol: HLF2 | ||
| Type: protein-coding gene | Cytoband: 3p21.31 | ||
| Entrez ID: 4057 | HGNC ID: HGNC:6720 | Ensembl Gene: ENSG00000012223 | OMIM ID: 150210 |
| Related drugs: BACITRACIN, RESERPINE... [more] | |||
Screen Evidence:
| |||
Expression of LTF:
| Dataset | Gene | EntrezID | Probe | Log2FC | Adj.pValue | Expression |
|---|---|---|---|---|---|---|
| GSE17351 | LTF | 4057 | 202018_s_at | -0.1533 | 0.9518 | |
| GSE20347 | LTF | 4057 | 202018_s_at | -0.4368 | 0.4256 | |
| GSE23400 | LTF | 4057 | 202018_s_at | -0.7995 | 0.0001 | |
| GSE26886 | LTF | 4057 | 202018_s_at | -1.1164 | 0.1756 | |
| GSE29001 | LTF | 4057 | 202018_s_at | 0.2417 | 0.7469 | |
| GSE38129 | LTF | 4057 | 202018_s_at | -0.8555 | 0.0661 | |
| GSE45670 | LTF | 4057 | 202018_s_at | -0.1157 | 0.9190 | |
| GSE53622 | LTF | 4057 | 44432 | -1.9879 | 0.0000 | |
| GSE53624 | LTF | 4057 | 44432 | -2.5452 | 0.0000 | |
| GSE63941 | LTF | 4057 | 202018_s_at | 0.1250 | 0.4821 | |
| GSE77861 | LTF | 4057 | 202018_s_at | 0.7859 | 0.4114 | |
| GSE97050 | LTF | 4057 | A_23_P166848 | 0.6764 | 0.5708 | |
| SRP133303 | LTF | 4057 | RNAseq | -2.6827 | 0.0018 | |
| SRP159526 | LTF | 4057 | RNAseq | -1.0196 | 0.3775 | |
| SRP219564 | LTF | 4057 | RNAseq | 0.4989 | 0.7099 | |
| TCGA | LTF | 4057 | RNAseq | -1.2844 | 0.0252 |
Upregulated datasets: 0; Downregulated datasets: 4.
Survival by LTF expression:
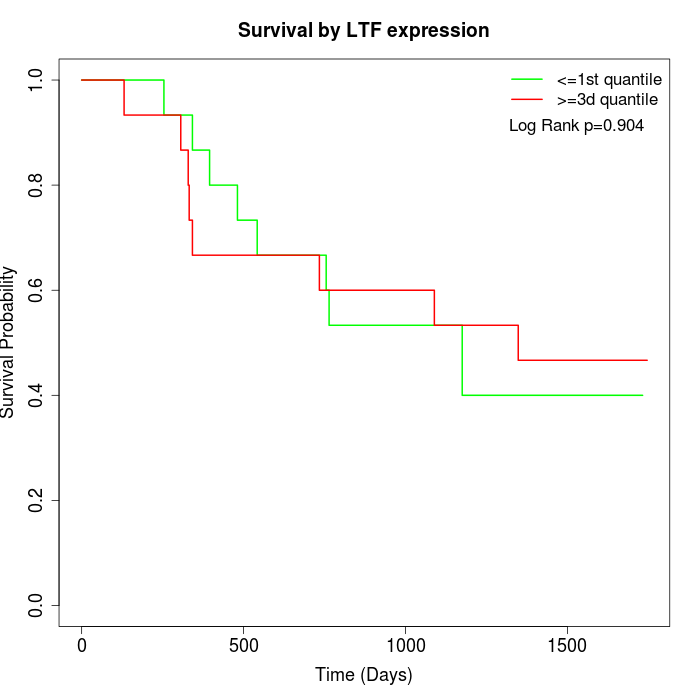 | 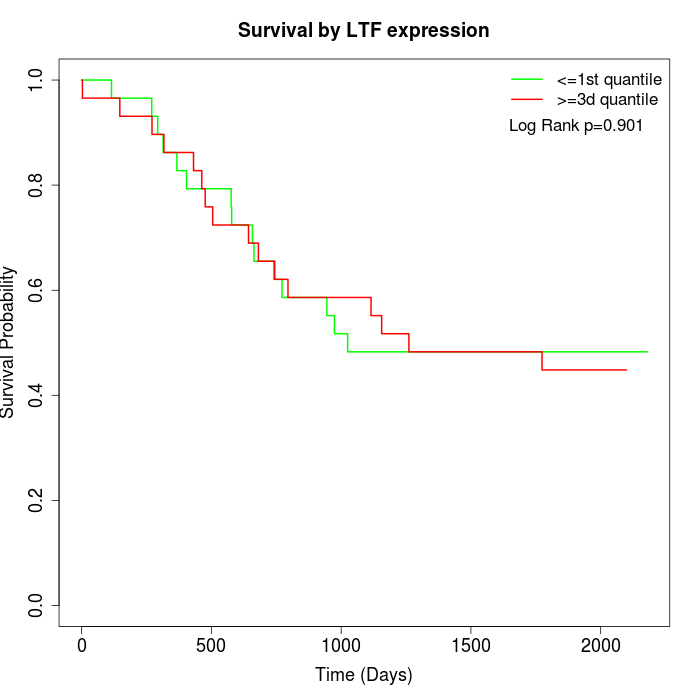 | 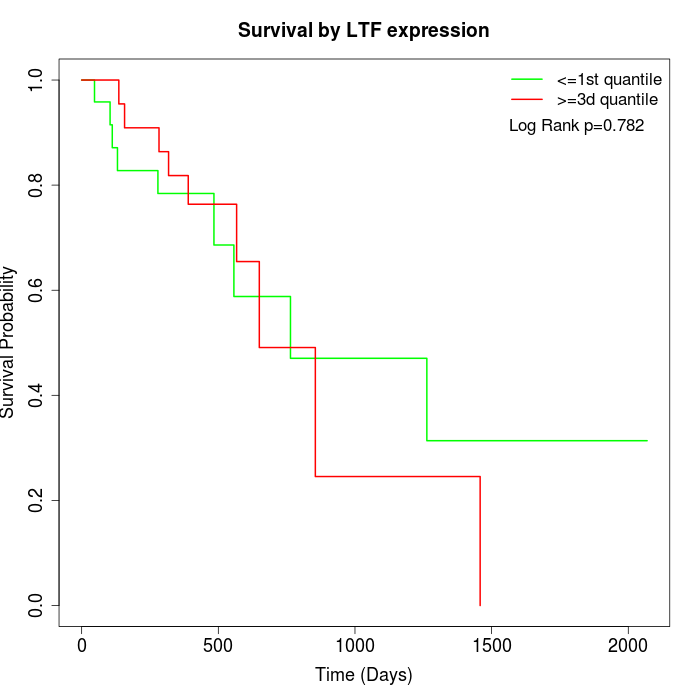 |
| GSE53622 | GSE53624 | TCGA |
Note: Click image to view full size file.
Copy number change of LTF:
| Dataset | Gene | EntrezID | Gain | Loss | Normal | Detail |
|---|---|---|---|---|---|---|
| GSE15526 | LTF | 4057 | 0 | 17 | 13 | |
| GSE20123 | LTF | 4057 | 0 | 18 | 12 | |
| GSE43470 | LTF | 4057 | 0 | 20 | 23 | |
| GSE46452 | LTF | 4057 | 2 | 17 | 40 | |
| GSE47630 | LTF | 4057 | 2 | 23 | 15 | |
| GSE54993 | LTF | 4057 | 7 | 2 | 61 | |
| GSE54994 | LTF | 4057 | 0 | 36 | 17 | |
| GSE60625 | LTF | 4057 | 5 | 0 | 6 | |
| GSE74703 | LTF | 4057 | 0 | 15 | 21 | |
| GSE74704 | LTF | 4057 | 0 | 12 | 8 | |
| TCGA | LTF | 4057 | 1 | 75 | 20 |
Total number of gains: 17; Total number of losses: 235; Total Number of normals: 236.
Somatic mutations of LTF:
Generating mutation plots.
Highly correlated genes for LTF:
Showing top 20/138 corelated genes with mean PCC>0.5.
| Gene1 | Gene2 | Mean PCC | Num. Datasets | Num. PCC<0 | Num. PCC>0.5 |
|---|---|---|---|---|---|
| LTF | ADAMDEC1 | 0.757877 | 3 | 0 | 3 |
| LTF | INHBB | 0.743099 | 3 | 0 | 3 |
| LTF | RNF145 | 0.719789 | 3 | 0 | 3 |
| LTF | PIK3AP1 | 0.716984 | 3 | 0 | 3 |
| LTF | ANPEP | 0.712395 | 4 | 0 | 4 |
| LTF | CLEC4A | 0.691455 | 3 | 0 | 3 |
| LTF | SELPLG | 0.674046 | 3 | 0 | 3 |
| LTF | TMEM45A | 0.666528 | 3 | 0 | 3 |
| LTF | KRT81 | 0.66298 | 3 | 0 | 3 |
| LTF | ITGB2 | 0.662034 | 3 | 0 | 3 |
| LTF | CD53 | 0.660635 | 4 | 0 | 3 |
| LTF | SAA2 | 0.660167 | 3 | 0 | 3 |
| LTF | LCP1 | 0.657055 | 4 | 0 | 3 |
| LTF | CFB | 0.652334 | 4 | 0 | 4 |
| LTF | FDCSP | 0.647263 | 5 | 0 | 4 |
| LTF | GK | 0.643661 | 4 | 0 | 3 |
| LTF | RAB37 | 0.63428 | 3 | 0 | 3 |
| LTF | ZNF334 | 0.632338 | 3 | 0 | 3 |
| LTF | SHMT1 | 0.626433 | 3 | 0 | 3 |
| LTF | MS4A7 | 0.618044 | 3 | 0 | 3 |
For details and further investigation, click here