| Full name: membrane bound transcription factor peptidase, site 1 | Alias Symbol: S1P|KIAA0091|SKI-1|PCSK8 | ||
| Type: protein-coding gene | Cytoband: 16q23.3-q24.1 | ||
| Entrez ID: 8720 | HGNC ID: HGNC:15456 | Ensembl Gene: ENSG00000140943 | OMIM ID: 603355 |
Screen Evidence:
| |||
Expression of MBTPS1:
| Dataset | Gene | EntrezID | Probe | Log2FC | Adj.pValue | Expression |
|---|---|---|---|---|---|---|
| GSE17351 | MBTPS1 | 8720 | 201620_at | 0.4380 | 0.1460 | |
| GSE20347 | MBTPS1 | 8720 | 201620_at | 0.3951 | 0.0017 | |
| GSE23400 | MBTPS1 | 8720 | 201620_at | 0.4749 | 0.0000 | |
| GSE26886 | MBTPS1 | 8720 | 201620_at | 0.5323 | 0.0076 | |
| GSE29001 | MBTPS1 | 8720 | 201620_at | 0.2705 | 0.3172 | |
| GSE38129 | MBTPS1 | 8720 | 201620_at | 0.3629 | 0.0011 | |
| GSE45670 | MBTPS1 | 8720 | 201620_at | 0.2821 | 0.0021 | |
| GSE53622 | MBTPS1 | 8720 | 10082 | 0.2117 | 0.0001 | |
| GSE53624 | MBTPS1 | 8720 | 10082 | 0.3363 | 0.0000 | |
| GSE63941 | MBTPS1 | 8720 | 201620_at | -0.5790 | 0.1344 | |
| GSE77861 | MBTPS1 | 8720 | 217543_s_at | 0.2099 | 0.2622 | |
| GSE97050 | MBTPS1 | 8720 | A_33_P3393941 | 0.0656 | 0.7574 | |
| SRP007169 | MBTPS1 | 8720 | RNAseq | 0.2545 | 0.3704 | |
| SRP008496 | MBTPS1 | 8720 | RNAseq | 0.3764 | 0.0786 | |
| SRP064894 | MBTPS1 | 8720 | RNAseq | 0.2295 | 0.0484 | |
| SRP133303 | MBTPS1 | 8720 | RNAseq | 0.3404 | 0.0335 | |
| SRP159526 | MBTPS1 | 8720 | RNAseq | 0.4681 | 0.0267 | |
| SRP193095 | MBTPS1 | 8720 | RNAseq | 0.2304 | 0.0103 | |
| SRP219564 | MBTPS1 | 8720 | RNAseq | 0.1357 | 0.6528 | |
| TCGA | MBTPS1 | 8720 | RNAseq | -0.0857 | 0.0387 |
Upregulated datasets: 0; Downregulated datasets: 0.
Survival by MBTPS1 expression:
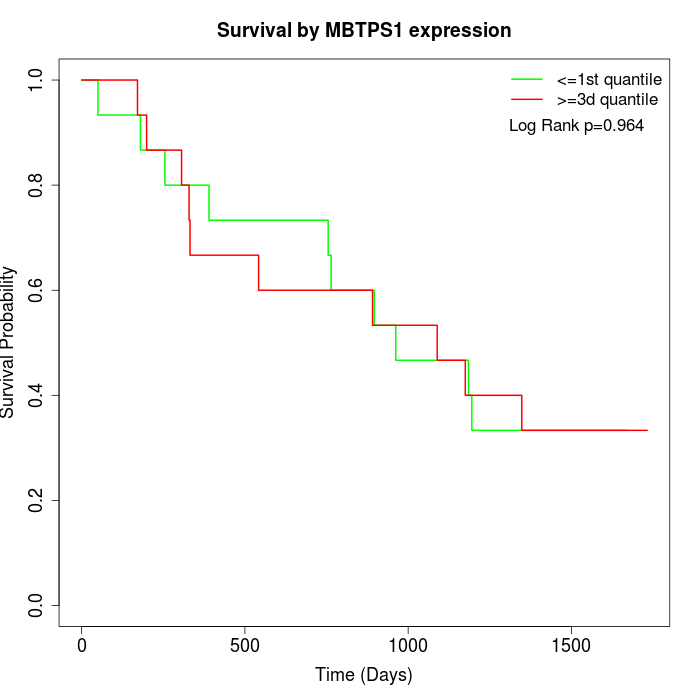 | 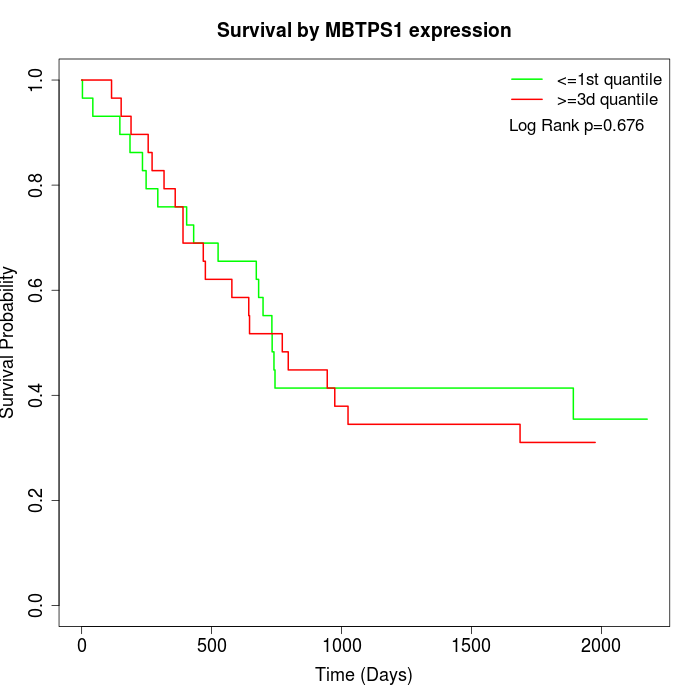 | 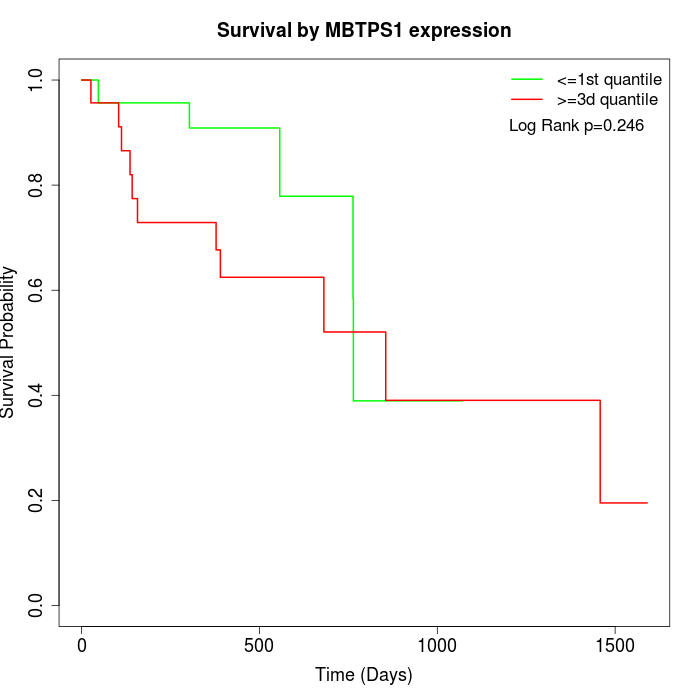 |
| GSE53622 | GSE53624 | TCGA |
Note: Click image to view full size file.
Copy number change of MBTPS1:
| Dataset | Gene | EntrezID | Gain | Loss | Normal | Detail |
|---|---|---|---|---|---|---|
| GSE15526 | MBTPS1 | 8720 | 4 | 4 | 22 | |
| GSE20123 | MBTPS1 | 8720 | 4 | 4 | 22 | |
| GSE43470 | MBTPS1 | 8720 | 2 | 10 | 31 | |
| GSE46452 | MBTPS1 | 8720 | 37 | 2 | 20 | |
| GSE47630 | MBTPS1 | 8720 | 11 | 9 | 20 | |
| GSE54993 | MBTPS1 | 8720 | 3 | 4 | 63 | |
| GSE54994 | MBTPS1 | 8720 | 8 | 10 | 35 | |
| GSE60625 | MBTPS1 | 8720 | 4 | 0 | 7 | |
| GSE74703 | MBTPS1 | 8720 | 2 | 7 | 27 | |
| GSE74704 | MBTPS1 | 8720 | 3 | 2 | 15 | |
| TCGA | MBTPS1 | 8720 | 25 | 17 | 54 |
Total number of gains: 103; Total number of losses: 69; Total Number of normals: 316.
Somatic mutations of MBTPS1:
Generating mutation plots.
Highly correlated genes for MBTPS1:
Showing top 20/768 corelated genes with mean PCC>0.5.
| Gene1 | Gene2 | Mean PCC | Num. Datasets | Num. PCC<0 | Num. PCC>0.5 |
|---|---|---|---|---|---|
| MBTPS1 | ZSCAN21 | 0.782347 | 3 | 0 | 3 |
| MBTPS1 | RNF139 | 0.748541 | 3 | 0 | 3 |
| MBTPS1 | TMEM165 | 0.732341 | 3 | 0 | 3 |
| MBTPS1 | VNN2 | 0.728393 | 3 | 0 | 3 |
| MBTPS1 | CUL7 | 0.719237 | 3 | 0 | 3 |
| MBTPS1 | GRAPL | 0.718234 | 3 | 0 | 3 |
| MBTPS1 | GTPBP6 | 0.713893 | 4 | 0 | 4 |
| MBTPS1 | KLHL36 | 0.707405 | 3 | 0 | 3 |
| MBTPS1 | FILIP1L | 0.702262 | 3 | 0 | 3 |
| MBTPS1 | LILRB2 | 0.69217 | 3 | 0 | 3 |
| MBTPS1 | GPX1 | 0.690836 | 4 | 0 | 4 |
| MBTPS1 | CLU | 0.682585 | 3 | 0 | 3 |
| MBTPS1 | ARL2 | 0.681426 | 3 | 0 | 3 |
| MBTPS1 | ELP2 | 0.676902 | 4 | 0 | 3 |
| MBTPS1 | TRPC4AP | 0.674872 | 3 | 0 | 3 |
| MBTPS1 | EXOC6 | 0.671464 | 4 | 0 | 3 |
| MBTPS1 | ARHGAP24 | 0.667385 | 4 | 0 | 3 |
| MBTPS1 | WDR81 | 0.667028 | 5 | 0 | 5 |
| MBTPS1 | RPA2 | 0.665438 | 6 | 0 | 6 |
| MBTPS1 | PI4KB | 0.662716 | 3 | 0 | 3 |
For details and further investigation, click here