| Full name: MDM2 proto-oncogene | Alias Symbol: HDM2|MGC5370 | ||
| Type: protein-coding gene | Cytoband: 12q15 | ||
| Entrez ID: 4193 | HGNC ID: HGNC:6973 | Ensembl Gene: ENSG00000135679 | OMIM ID: 164785 |
| Related drugs: CHEMBL35482... [more] | |||
Screen Evidence:
| |||
MDM2 involved pathways:
Expression of MDM2:
| Dataset | Gene | EntrezID | Probe | Log2FC | Adj.pValue | Expression |
|---|---|---|---|---|---|---|
| GSE17351 | MDM2 | 4193 | 229711_s_at | 0.5203 | 0.3206 | |
| GSE20347 | MDM2 | 4193 | 217542_at | -0.2273 | 0.0424 | |
| GSE23400 | MDM2 | 4193 | 205385_at | 0.0109 | 0.7332 | |
| GSE26886 | MDM2 | 4193 | 229711_s_at | 0.6188 | 0.0014 | |
| GSE29001 | MDM2 | 4193 | 217542_at | -0.0224 | 0.9539 | |
| GSE38129 | MDM2 | 4193 | 217542_at | -0.0449 | 0.7516 | |
| GSE45670 | MDM2 | 4193 | 229711_s_at | 0.2441 | 0.1054 | |
| GSE53622 | MDM2 | 4193 | 67431 | 0.1988 | 0.0015 | |
| GSE53624 | MDM2 | 4193 | 67431 | -0.4095 | 0.0000 | |
| GSE63941 | MDM2 | 4193 | 229711_s_at | -0.9846 | 0.1349 | |
| GSE77861 | MDM2 | 4193 | 229711_s_at | 0.0824 | 0.7539 | |
| GSE97050 | MDM2 | 4193 | A_33_P3361707 | 0.2860 | 0.2027 | |
| SRP007169 | MDM2 | 4193 | RNAseq | 0.2691 | 0.4697 | |
| SRP008496 | MDM2 | 4193 | RNAseq | 0.3716 | 0.0710 | |
| SRP064894 | MDM2 | 4193 | RNAseq | 0.1365 | 0.5685 | |
| SRP133303 | MDM2 | 4193 | RNAseq | 0.2158 | 0.1343 | |
| SRP159526 | MDM2 | 4193 | RNAseq | 0.3473 | 0.1162 | |
| SRP193095 | MDM2 | 4193 | RNAseq | -0.1133 | 0.3073 | |
| SRP219564 | MDM2 | 4193 | RNAseq | 1.3389 | 0.0508 | |
| TCGA | MDM2 | 4193 | RNAseq | 0.0114 | 0.8724 |
Upregulated datasets: 0; Downregulated datasets: 0.
Survival by MDM2 expression:
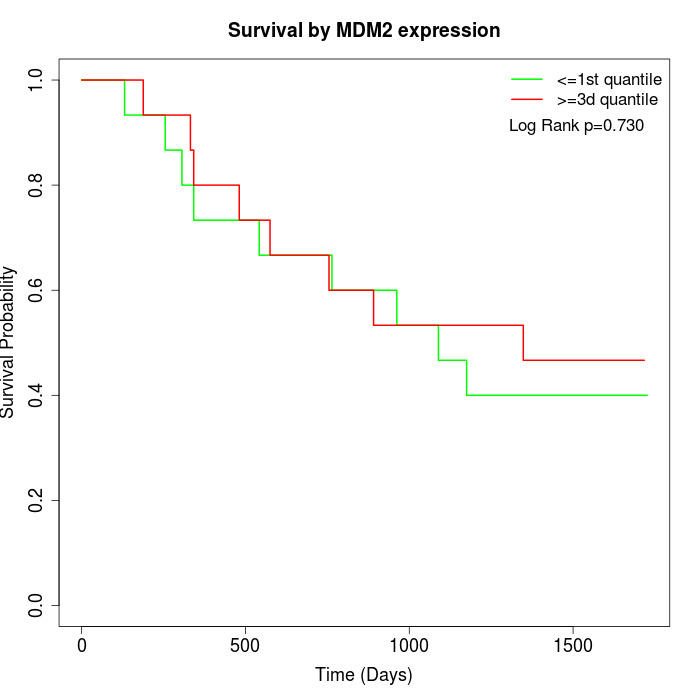 | 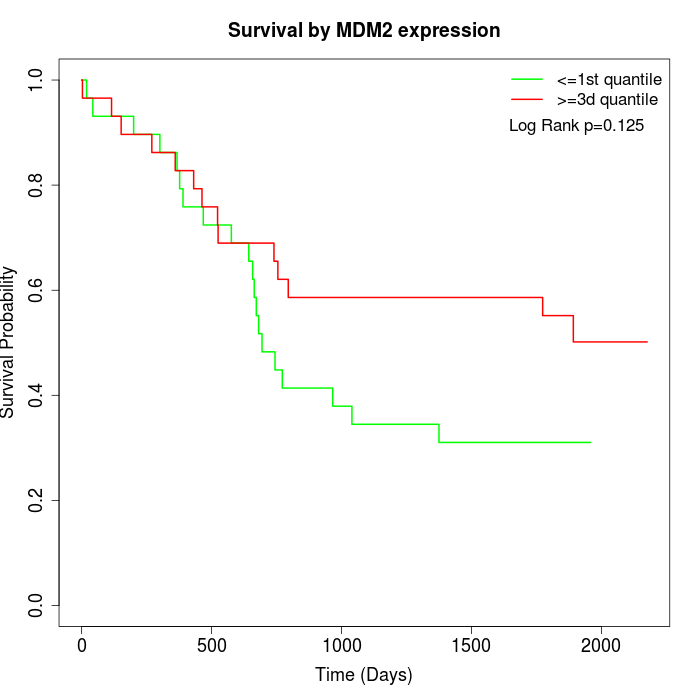 | 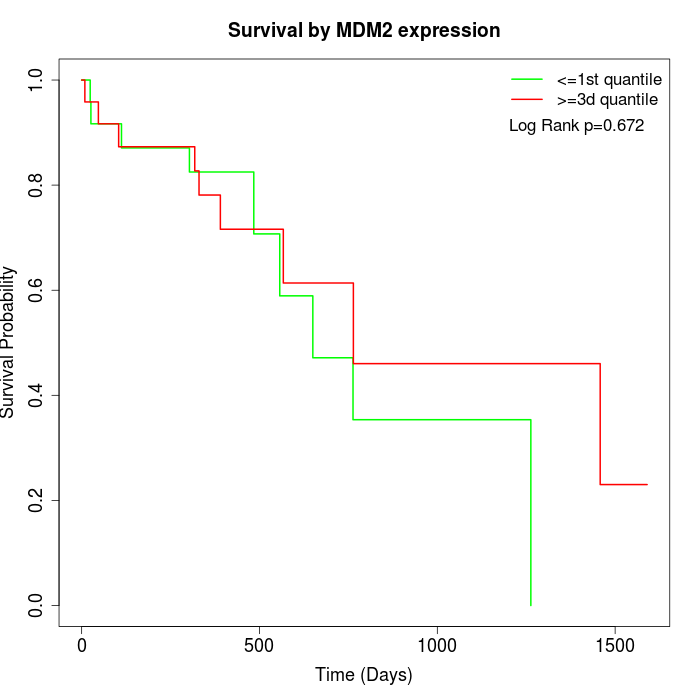 |
| GSE53622 | GSE53624 | TCGA |
Note: Click image to view full size file.
Copy number change of MDM2:
| Dataset | Gene | EntrezID | Gain | Loss | Normal | Detail |
|---|---|---|---|---|---|---|
| GSE15526 | MDM2 | 4193 | 6 | 1 | 23 | |
| GSE20123 | MDM2 | 4193 | 6 | 0 | 24 | |
| GSE43470 | MDM2 | 4193 | 5 | 0 | 38 | |
| GSE46452 | MDM2 | 4193 | 12 | 0 | 47 | |
| GSE47630 | MDM2 | 4193 | 10 | 1 | 29 | |
| GSE54993 | MDM2 | 4193 | 0 | 7 | 63 | |
| GSE54994 | MDM2 | 4193 | 7 | 1 | 45 | |
| GSE60625 | MDM2 | 4193 | 0 | 0 | 11 | |
| GSE74703 | MDM2 | 4193 | 5 | 0 | 31 | |
| GSE74704 | MDM2 | 4193 | 5 | 0 | 15 | |
| TCGA | MDM2 | 4193 | 23 | 8 | 65 |
Total number of gains: 79; Total number of losses: 18; Total Number of normals: 391.
Somatic mutations of MDM2:
Generating mutation plots.
Highly correlated genes for MDM2:
Showing top 20/199 corelated genes with mean PCC>0.5.
| Gene1 | Gene2 | Mean PCC | Num. Datasets | Num. PCC<0 | Num. PCC>0.5 |
|---|---|---|---|---|---|
| MDM2 | TRMT6 | 0.827312 | 3 | 0 | 3 |
| MDM2 | CHD4 | 0.805224 | 3 | 0 | 3 |
| MDM2 | PFAS | 0.797949 | 3 | 0 | 3 |
| MDM2 | RPP40 | 0.781304 | 3 | 0 | 3 |
| MDM2 | MGAT4B | 0.776689 | 3 | 0 | 3 |
| MDM2 | HNRNPR | 0.776313 | 3 | 0 | 3 |
| MDM2 | SRPK1 | 0.77567 | 3 | 0 | 3 |
| MDM2 | BAG4 | 0.775261 | 3 | 0 | 3 |
| MDM2 | SEC22A | 0.764607 | 3 | 0 | 3 |
| MDM2 | NUP153 | 0.758586 | 3 | 0 | 3 |
| MDM2 | PAIP1 | 0.751875 | 3 | 0 | 3 |
| MDM2 | NUP54 | 0.751116 | 4 | 0 | 4 |
| MDM2 | ANKIB1 | 0.747745 | 3 | 0 | 3 |
| MDM2 | TBL2 | 0.744773 | 3 | 0 | 3 |
| MDM2 | PHTF2 | 0.742619 | 3 | 0 | 3 |
| MDM2 | NHS | 0.735473 | 3 | 0 | 3 |
| MDM2 | STX6 | 0.734366 | 4 | 0 | 4 |
| MDM2 | KIAA1841 | 0.73272 | 3 | 0 | 3 |
| MDM2 | HERC4 | 0.726423 | 3 | 0 | 3 |
| MDM2 | SRP72 | 0.724421 | 3 | 0 | 3 |
For details and further investigation, click here