| Full name: malic enzyme 1 | Alias Symbol: | ||
| Type: protein-coding gene | Cytoband: 6q14.2 | ||
| Entrez ID: 4199 | HGNC ID: HGNC:6983 | Ensembl Gene: ENSG00000065833 | OMIM ID: 154250 |
ME1 involved pathways:
| KEGG pathway | Description | View |
|---|---|---|
| hsa03320 | PPAR signaling pathway |
Expression of ME1:
| Dataset | Gene | EntrezID | Probe | Log2FC | Adj.pValue | Expression |
|---|---|---|---|---|---|---|
| GSE17351 | ME1 | 4199 | 204059_s_at | -0.3461 | 0.6697 | |
| GSE20347 | ME1 | 4199 | 204059_s_at | -0.5602 | 0.1813 | |
| GSE23400 | ME1 | 4199 | 204059_s_at | -0.5018 | 0.0042 | |
| GSE26886 | ME1 | 4199 | 204059_s_at | -1.1595 | 0.0094 | |
| GSE29001 | ME1 | 4199 | 204059_s_at | -0.7452 | 0.0372 | |
| GSE38129 | ME1 | 4199 | 204059_s_at | -0.2351 | 0.5416 | |
| GSE45670 | ME1 | 4199 | 204059_s_at | -0.4207 | 0.3151 | |
| GSE53622 | ME1 | 4199 | 107034 | -1.0910 | 0.0000 | |
| GSE53624 | ME1 | 4199 | 107034 | -1.2352 | 0.0000 | |
| GSE63941 | ME1 | 4199 | 204059_s_at | -0.6059 | 0.4735 | |
| GSE77861 | ME1 | 4199 | 204059_s_at | 0.3300 | 0.5581 | |
| GSE97050 | ME1 | 4199 | A_23_P8196 | -0.5443 | 0.1816 | |
| SRP007169 | ME1 | 4199 | RNAseq | -0.0091 | 0.9852 | |
| SRP008496 | ME1 | 4199 | RNAseq | -0.2074 | 0.5312 | |
| SRP064894 | ME1 | 4199 | RNAseq | -1.3193 | 0.0000 | |
| SRP133303 | ME1 | 4199 | RNAseq | -0.6886 | 0.0004 | |
| SRP159526 | ME1 | 4199 | RNAseq | 0.6951 | 0.3858 | |
| SRP193095 | ME1 | 4199 | RNAseq | -0.8411 | 0.0002 | |
| SRP219564 | ME1 | 4199 | RNAseq | -0.9934 | 0.0921 | |
| TCGA | ME1 | 4199 | RNAseq | 0.0963 | 0.4270 |
Upregulated datasets: 0; Downregulated datasets: 4.
Survival by ME1 expression:
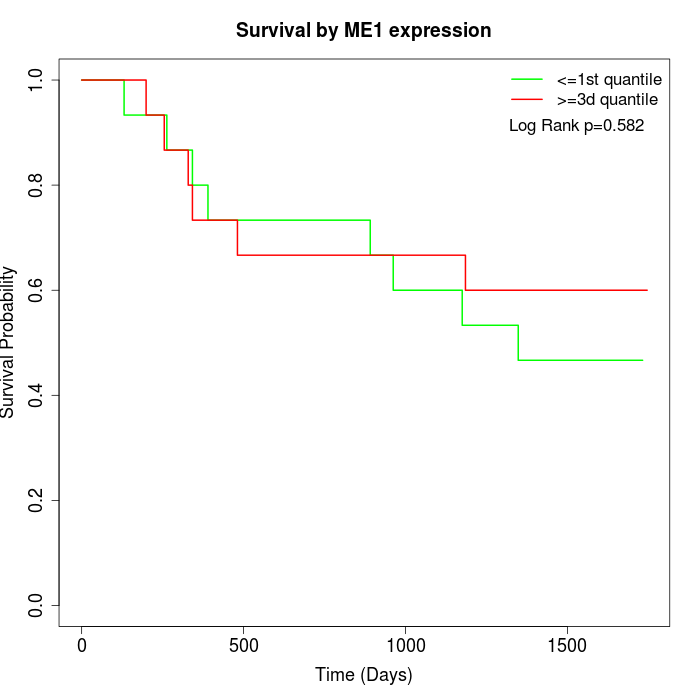 | 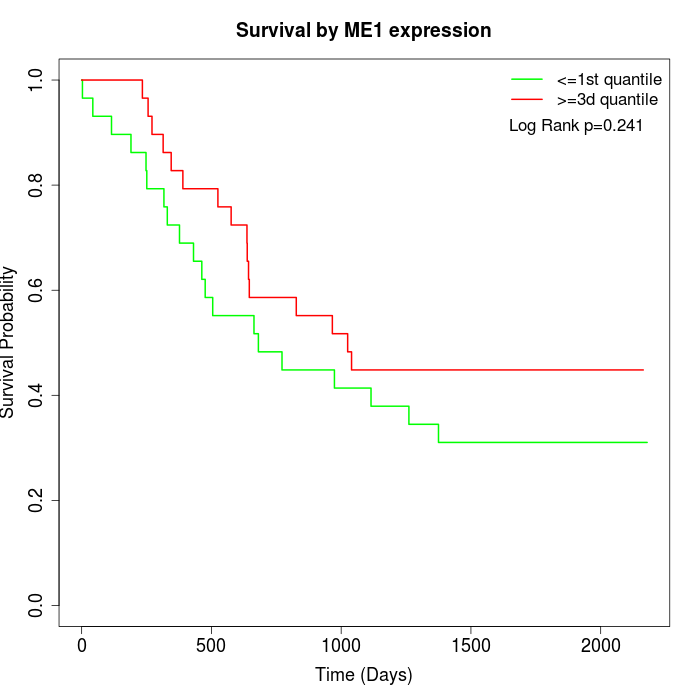 | 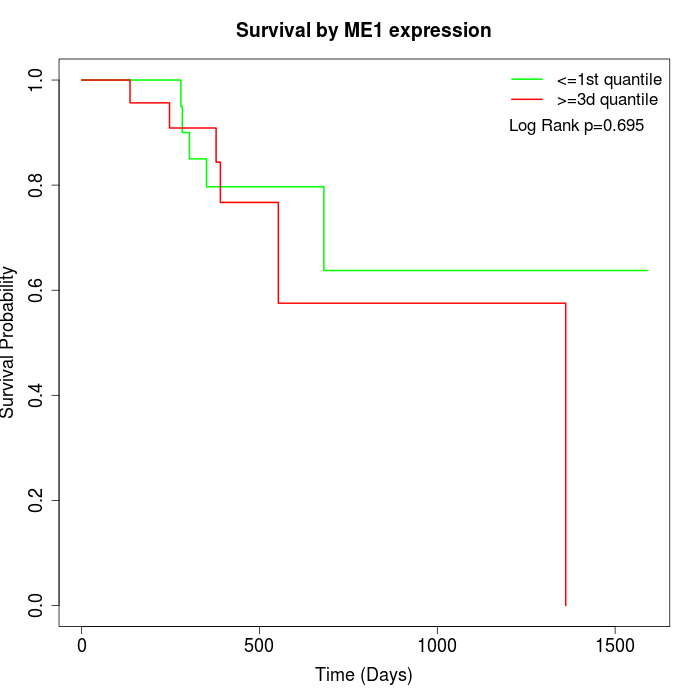 |
| GSE53622 | GSE53624 | TCGA |
Note: Click image to view full size file.
Copy number change of ME1:
| Dataset | Gene | EntrezID | Gain | Loss | Normal | Detail |
|---|---|---|---|---|---|---|
| GSE15526 | ME1 | 4199 | 1 | 4 | 25 | |
| GSE20123 | ME1 | 4199 | 1 | 3 | 26 | |
| GSE43470 | ME1 | 4199 | 2 | 1 | 40 | |
| GSE46452 | ME1 | 4199 | 2 | 11 | 46 | |
| GSE47630 | ME1 | 4199 | 8 | 6 | 26 | |
| GSE54993 | ME1 | 4199 | 3 | 2 | 65 | |
| GSE54994 | ME1 | 4199 | 8 | 8 | 37 | |
| GSE60625 | ME1 | 4199 | 0 | 1 | 10 | |
| GSE74703 | ME1 | 4199 | 2 | 1 | 33 | |
| GSE74704 | ME1 | 4199 | 0 | 2 | 18 | |
| TCGA | ME1 | 4199 | 6 | 24 | 66 |
Total number of gains: 33; Total number of losses: 63; Total Number of normals: 392.
Somatic mutations of ME1:
Generating mutation plots.
Highly correlated genes for ME1:
Showing top 20/541 corelated genes with mean PCC>0.5.
| Gene1 | Gene2 | Mean PCC | Num. Datasets | Num. PCC<0 | Num. PCC>0.5 |
|---|---|---|---|---|---|
| ME1 | MFAP3 | 0.668782 | 3 | 0 | 3 |
| ME1 | MUC15 | 0.664249 | 6 | 0 | 6 |
| ME1 | SRXN1 | 0.661139 | 5 | 0 | 4 |
| ME1 | CYP4F2 | 0.658326 | 11 | 0 | 11 |
| ME1 | CYP4F3 | 0.657235 | 12 | 0 | 10 |
| ME1 | ALDH3A2 | 0.641568 | 11 | 0 | 10 |
| ME1 | GPX6 | 0.638582 | 3 | 0 | 3 |
| ME1 | SPAG17 | 0.638538 | 4 | 0 | 4 |
| ME1 | TALDO1 | 0.636367 | 11 | 0 | 10 |
| ME1 | CDK5R1 | 0.635972 | 6 | 0 | 5 |
| ME1 | TUBA4A | 0.634561 | 4 | 0 | 3 |
| ME1 | ALDH3A1 | 0.630195 | 13 | 0 | 11 |
| ME1 | ADH7 | 0.628364 | 12 | 0 | 10 |
| ME1 | CBR3-AS1 | 0.627863 | 3 | 0 | 3 |
| ME1 | NQO1 | 0.625459 | 11 | 0 | 9 |
| ME1 | TUBB4B | 0.625412 | 3 | 0 | 3 |
| ME1 | SLC10A5 | 0.625253 | 3 | 0 | 3 |
| ME1 | HK1 | 0.623805 | 10 | 0 | 7 |
| ME1 | TMEM45B | 0.620899 | 6 | 0 | 6 |
| ME1 | FLG-AS1 | 0.620788 | 6 | 0 | 5 |
For details and further investigation, click here