| Full name: malignant fibrous histiocytoma amplified sequence 1 | Alias Symbol: MASL1|LRRC65|ROCO4 | ||
| Type: protein-coding gene | Cytoband: 8p23.1 | ||
| Entrez ID: 9258 | HGNC ID: HGNC:16982 | Ensembl Gene: ENSG00000147324 | OMIM ID: 605352 |
Expression of MFHAS1:
| Dataset | Gene | EntrezID | Probe | Log2FC | Adj.pValue | Expression |
|---|---|---|---|---|---|---|
| GSE17351 | MFHAS1 | 9258 | 225478_at | 1.5308 | 0.0538 | |
| GSE20347 | MFHAS1 | 9258 | 213457_at | 2.3626 | 0.0000 | |
| GSE23400 | MFHAS1 | 9258 | 213457_at | 1.4367 | 0.0000 | |
| GSE26886 | MFHAS1 | 9258 | 225478_at | 2.3035 | 0.0000 | |
| GSE29001 | MFHAS1 | 9258 | 213457_at | 2.6764 | 0.0000 | |
| GSE38129 | MFHAS1 | 9258 | 213457_at | 1.5692 | 0.0000 | |
| GSE45670 | MFHAS1 | 9258 | 225478_at | 1.1765 | 0.0012 | |
| GSE53622 | MFHAS1 | 9258 | 112569 | 1.3351 | 0.0000 | |
| GSE53624 | MFHAS1 | 9258 | 112569 | 1.5951 | 0.0000 | |
| GSE63941 | MFHAS1 | 9258 | 225478_at | -0.4888 | 0.4154 | |
| GSE77861 | MFHAS1 | 9258 | 225478_at | 2.0743 | 0.0004 | |
| GSE97050 | MFHAS1 | 9258 | A_33_P3256680 | 0.4989 | 0.2470 | |
| SRP007169 | MFHAS1 | 9258 | RNAseq | 4.6599 | 0.0000 | |
| SRP008496 | MFHAS1 | 9258 | RNAseq | 3.7153 | 0.0000 | |
| SRP064894 | MFHAS1 | 9258 | RNAseq | 1.2113 | 0.0000 | |
| SRP133303 | MFHAS1 | 9258 | RNAseq | 1.3738 | 0.0000 | |
| SRP159526 | MFHAS1 | 9258 | RNAseq | 1.8920 | 0.0000 | |
| SRP193095 | MFHAS1 | 9258 | RNAseq | 1.5574 | 0.0000 | |
| SRP219564 | MFHAS1 | 9258 | RNAseq | 0.6975 | 0.2154 | |
| TCGA | MFHAS1 | 9258 | RNAseq | 0.1430 | 0.0992 |
Upregulated datasets: 15; Downregulated datasets: 0.
Survival by MFHAS1 expression:
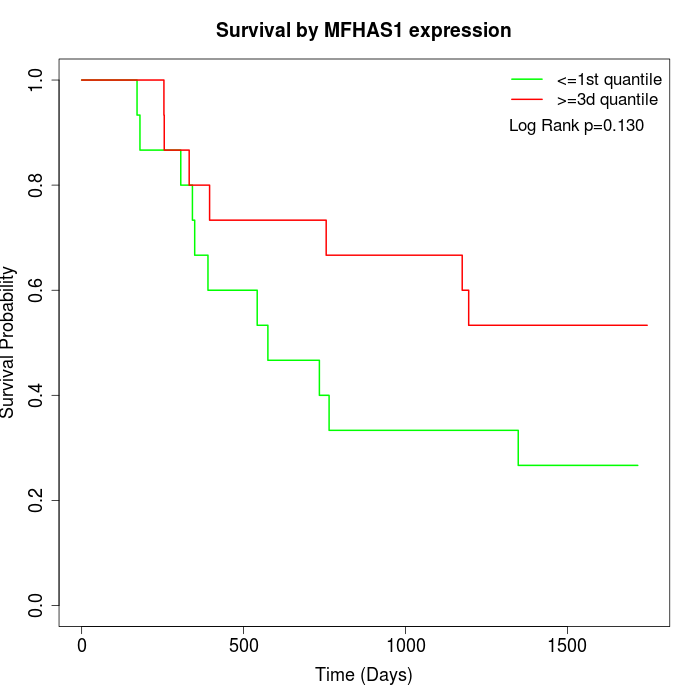 | 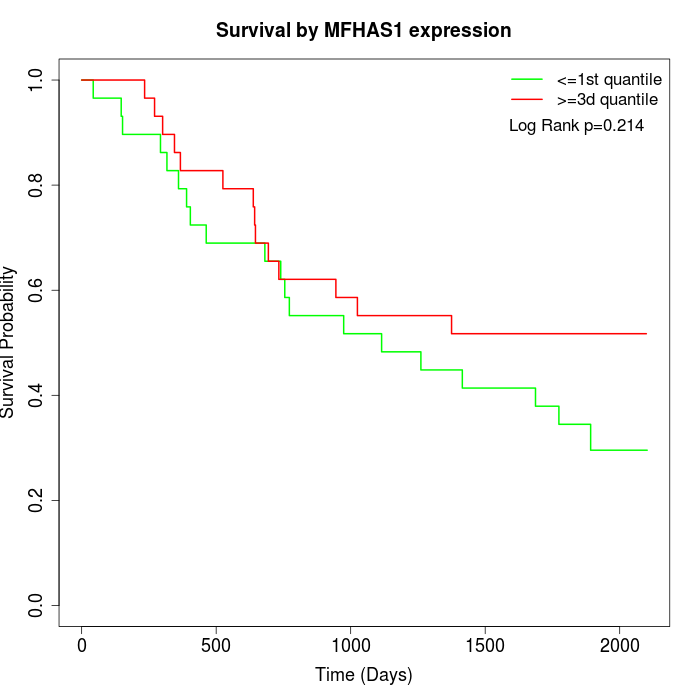 | 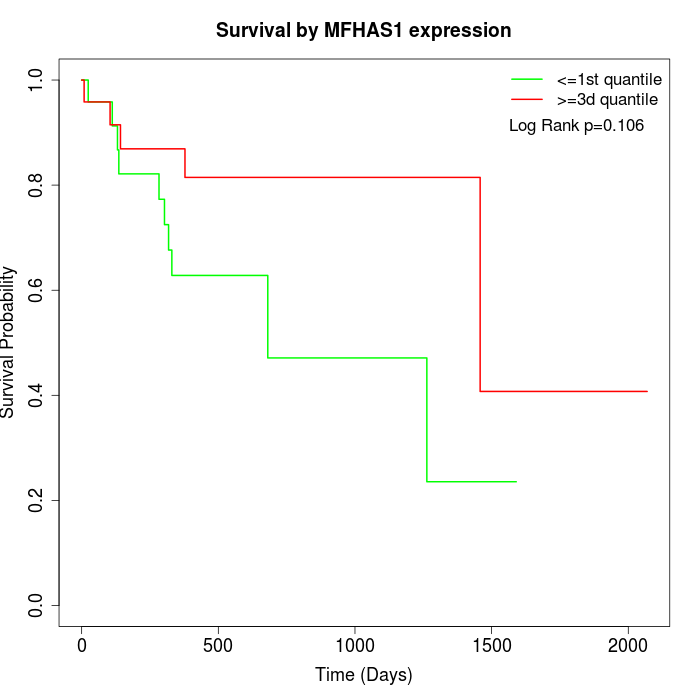 |
| GSE53622 | GSE53624 | TCGA |
Note: Click image to view full size file.
Copy number change of MFHAS1:
| Dataset | Gene | EntrezID | Gain | Loss | Normal | Detail |
|---|---|---|---|---|---|---|
| GSE15526 | MFHAS1 | 9258 | 4 | 10 | 16 | |
| GSE20123 | MFHAS1 | 9258 | 4 | 10 | 16 | |
| GSE43470 | MFHAS1 | 9258 | 4 | 9 | 30 | |
| GSE46452 | MFHAS1 | 9258 | 12 | 14 | 33 | |
| GSE47630 | MFHAS1 | 9258 | 10 | 7 | 23 | |
| GSE54993 | MFHAS1 | 9258 | 3 | 14 | 53 | |
| GSE54994 | MFHAS1 | 9258 | 9 | 18 | 26 | |
| GSE60625 | MFHAS1 | 9258 | 3 | 0 | 8 | |
| GSE74703 | MFHAS1 | 9258 | 4 | 7 | 25 | |
| GSE74704 | MFHAS1 | 9258 | 3 | 7 | 10 | |
| TCGA | MFHAS1 | 9258 | 13 | 41 | 42 |
Total number of gains: 69; Total number of losses: 137; Total Number of normals: 282.
Somatic mutations of MFHAS1:
Generating mutation plots.
Highly correlated genes for MFHAS1:
Showing top 20/2222 corelated genes with mean PCC>0.5.
| Gene1 | Gene2 | Mean PCC | Num. Datasets | Num. PCC<0 | Num. PCC>0.5 |
|---|---|---|---|---|---|
| MFHAS1 | ALKBH6 | 0.816698 | 4 | 0 | 4 |
| MFHAS1 | ZBED1 | 0.813185 | 3 | 0 | 3 |
| MFHAS1 | FADS1 | 0.786615 | 3 | 0 | 3 |
| MFHAS1 | ALG1 | 0.778294 | 5 | 0 | 5 |
| MFHAS1 | SESTD1 | 0.777941 | 3 | 0 | 3 |
| MFHAS1 | MRPL47 | 0.775614 | 7 | 0 | 7 |
| MFHAS1 | PKIG | 0.775014 | 3 | 0 | 3 |
| MFHAS1 | WDR81 | 0.769322 | 4 | 0 | 3 |
| MFHAS1 | DOCK11 | 0.768476 | 3 | 0 | 3 |
| MFHAS1 | CMSS1 | 0.767823 | 6 | 0 | 6 |
| MFHAS1 | COMMD2 | 0.766951 | 5 | 0 | 5 |
| MFHAS1 | TMTC1 | 0.765145 | 3 | 0 | 3 |
| MFHAS1 | DTX4 | 0.763832 | 3 | 0 | 3 |
| MFHAS1 | SGCE | 0.760814 | 3 | 0 | 3 |
| MFHAS1 | DHX36 | 0.759419 | 6 | 0 | 6 |
| MFHAS1 | SLC39A3 | 0.757248 | 3 | 0 | 3 |
| MFHAS1 | MET | 0.755457 | 9 | 0 | 9 |
| MFHAS1 | COLGALT1 | 0.753825 | 10 | 0 | 10 |
| MFHAS1 | PYCR2 | 0.751688 | 3 | 0 | 3 |
| MFHAS1 | MRPS23 | 0.74286 | 7 | 0 | 7 |
For details and further investigation, click here