| Full name: MET proto-oncogene, receptor tyrosine kinase | Alias Symbol: HGFR|RCCP2|DFNB97 | ||
| Type: protein-coding gene | Cytoband: 7q31 | ||
| Entrez ID: 4233 | HGNC ID: HGNC:7029 | Ensembl Gene: ENSG00000105976 | OMIM ID: 164860 |
| Related drugs: ABT-700, AFATINIB, ALECTINIB, ALTIRATINIB, ALVESPIMYCIN, AMG-208, AMG-337, AMOXICILLIN, AMUVATINIB, ARRY-300... [more] | |||
Screen Evidence:
| |||
MET involved pathways:
Expression of MET:
| Dataset | Gene | EntrezID | Probe | Log2FC | Adj.pValue | Expression |
|---|---|---|---|---|---|---|
| GSE17351 | MET | 4233 | 203510_at | 0.7827 | 0.5794 | |
| GSE20347 | MET | 4233 | 203510_at | 2.4146 | 0.0000 | |
| GSE23400 | MET | 4233 | 211599_x_at | 0.2745 | 0.0000 | |
| GSE26886 | MET | 4233 | 203510_at | 2.5551 | 0.0000 | |
| GSE29001 | MET | 4233 | 203510_at | 2.3595 | 0.0000 | |
| GSE38129 | MET | 4233 | 203510_at | 2.2617 | 0.0000 | |
| GSE45670 | MET | 4233 | 203510_at | 1.8441 | 0.0000 | |
| GSE53622 | MET | 4233 | 110044 | 1.6888 | 0.0000 | |
| GSE53624 | MET | 4233 | 110044 | 2.0142 | 0.0000 | |
| GSE63941 | MET | 4233 | 203510_at | 1.1327 | 0.0935 | |
| GSE77861 | MET | 4233 | 203510_at | 2.2401 | 0.0026 | |
| GSE97050 | MET | 4233 | A_23_P359245 | 1.4750 | 0.1057 | |
| SRP007169 | MET | 4233 | RNAseq | 2.9957 | 0.0000 | |
| SRP008496 | MET | 4233 | RNAseq | 2.8298 | 0.0000 | |
| SRP064894 | MET | 4233 | RNAseq | 1.5762 | 0.0000 | |
| SRP133303 | MET | 4233 | RNAseq | 1.9482 | 0.0000 | |
| SRP159526 | MET | 4233 | RNAseq | 1.5139 | 0.0003 | |
| SRP193095 | MET | 4233 | RNAseq | 1.5021 | 0.0000 | |
| SRP219564 | MET | 4233 | RNAseq | 1.8198 | 0.0060 | |
| TCGA | MET | 4233 | RNAseq | 0.1965 | 0.0225 |
Upregulated datasets: 15; Downregulated datasets: 0.
Survival by MET expression:
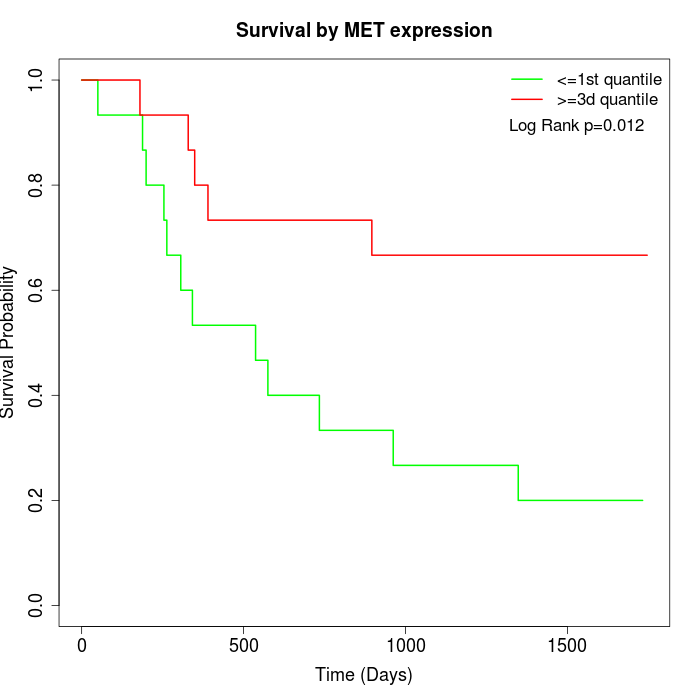 | 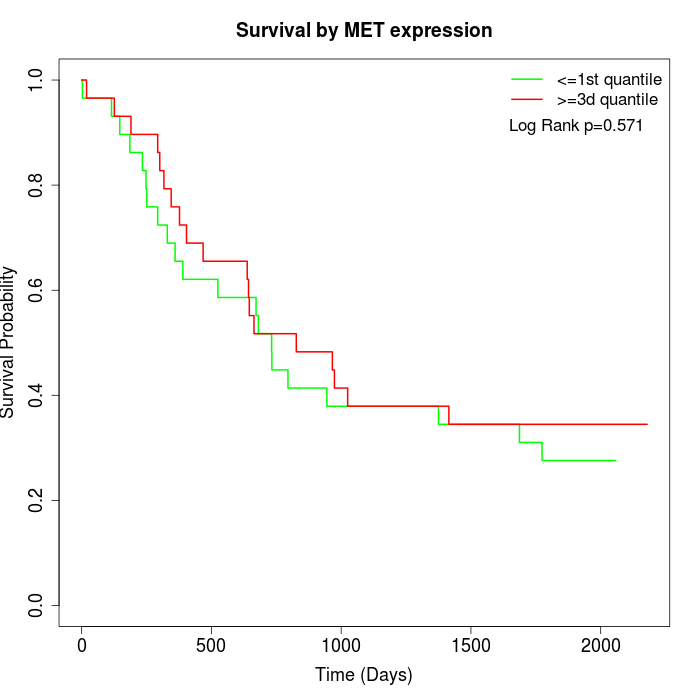 | 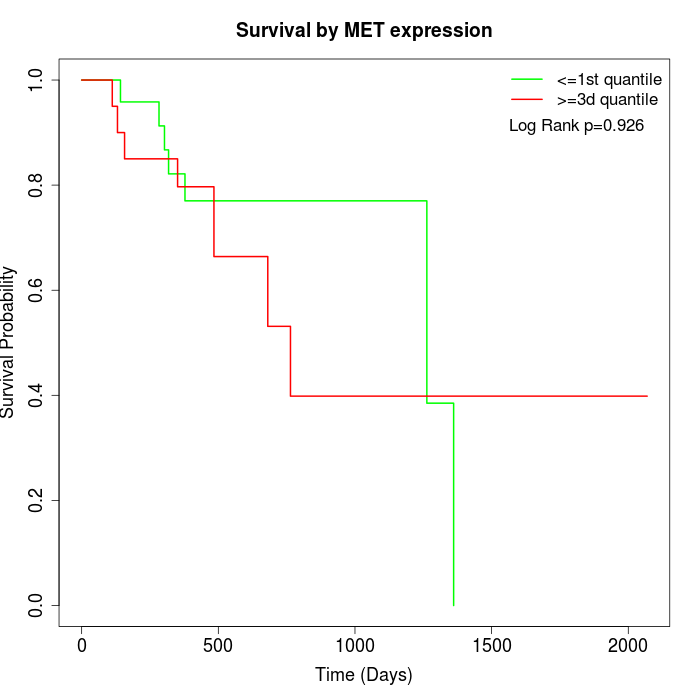 |
| GSE53622 | GSE53624 | TCGA |
Note: Click image to view full size file.
Copy number change of MET:
| Dataset | Gene | EntrezID | Gain | Loss | Normal | Detail |
|---|---|---|---|---|---|---|
| GSE15526 | MET | 4233 | 9 | 2 | 19 | |
| GSE20123 | MET | 4233 | 10 | 2 | 18 | |
| GSE43470 | MET | 4233 | 3 | 2 | 38 | |
| GSE46452 | MET | 4233 | 8 | 1 | 50 | |
| GSE47630 | MET | 4233 | 7 | 4 | 29 | |
| GSE54993 | MET | 4233 | 2 | 7 | 61 | |
| GSE54994 | MET | 4233 | 11 | 5 | 37 | |
| GSE60625 | MET | 4233 | 0 | 0 | 11 | |
| GSE74703 | MET | 4233 | 3 | 2 | 31 | |
| GSE74704 | MET | 4233 | 7 | 2 | 11 | |
| TCGA | MET | 4233 | 33 | 18 | 45 |
Total number of gains: 93; Total number of losses: 45; Total Number of normals: 350.
Somatic mutations of MET:
Generating mutation plots.
Highly correlated genes for MET:
Showing top 20/1960 corelated genes with mean PCC>0.5.
| Gene1 | Gene2 | Mean PCC | Num. Datasets | Num. PCC<0 | Num. PCC>0.5 |
|---|---|---|---|---|---|
| MET | FAM89A | 0.832353 | 3 | 0 | 3 |
| MET | CMSS1 | 0.816474 | 5 | 0 | 5 |
| MET | FMNL2 | 0.810772 | 7 | 0 | 7 |
| MET | C12orf75 | 0.80742 | 7 | 0 | 7 |
| MET | MMP1 | 0.789342 | 11 | 0 | 10 |
| MET | BRIX1 | 0.784736 | 9 | 0 | 9 |
| MET | SIX4 | 0.772974 | 6 | 0 | 6 |
| MET | WDR54 | 0.770595 | 7 | 0 | 7 |
| MET | ZNF281 | 0.767755 | 9 | 0 | 9 |
| MET | XPR1 | 0.766126 | 7 | 0 | 7 |
| MET | PARP12 | 0.765075 | 10 | 0 | 10 |
| MET | DCBLD1 | 0.763613 | 7 | 0 | 7 |
| MET | CENPL | 0.762175 | 6 | 0 | 6 |
| MET | MMP12 | 0.759629 | 11 | 0 | 10 |
| MET | MFHAS1 | 0.755457 | 9 | 0 | 9 |
| MET | PLAU | 0.754117 | 11 | 0 | 9 |
| MET | LAPTM4B | 0.749218 | 11 | 0 | 10 |
| MET | MTHFD2 | 0.748088 | 11 | 0 | 10 |
| MET | CENPW | 0.74602 | 6 | 0 | 6 |
| MET | CDCA2 | 0.745946 | 5 | 0 | 4 |
For details and further investigation, click here