| Full name: major facilitator superfamily domain containing 10 | Alias Symbol: TETRAN|IT10C3 | ||
| Type: protein-coding gene | Cytoband: 4p16.3 | ||
| Entrez ID: 10227 | HGNC ID: HGNC:16894 | Ensembl Gene: ENSG00000109736 | OMIM ID: 610977 |
Expression of MFSD10:
| Dataset | Gene | EntrezID | Probe | Log2FC | Adj.pValue | Expression |
|---|---|---|---|---|---|---|
| GSE17351 | MFSD10 | 10227 | 209215_at | 0.8835 | 0.1145 | |
| GSE20347 | MFSD10 | 10227 | 209215_at | 0.1402 | 0.4470 | |
| GSE23400 | MFSD10 | 10227 | 209215_at | 0.4422 | 0.0000 | |
| GSE26886 | MFSD10 | 10227 | 209215_at | 0.2846 | 0.2004 | |
| GSE29001 | MFSD10 | 10227 | 209215_at | 0.4953 | 0.2111 | |
| GSE38129 | MFSD10 | 10227 | 209215_at | 0.2288 | 0.0596 | |
| GSE45670 | MFSD10 | 10227 | 209215_at | 0.4036 | 0.0040 | |
| GSE53622 | MFSD10 | 10227 | 86741 | 0.6998 | 0.0000 | |
| GSE53624 | MFSD10 | 10227 | 52172 | 0.6705 | 0.0000 | |
| GSE63941 | MFSD10 | 10227 | 209215_at | -0.0697 | 0.8319 | |
| GSE77861 | MFSD10 | 10227 | 209215_at | 0.1738 | 0.6282 | |
| GSE97050 | MFSD10 | 10227 | A_23_P41246 | 0.4132 | 0.2172 | |
| SRP007169 | MFSD10 | 10227 | RNAseq | 0.1093 | 0.7741 | |
| SRP008496 | MFSD10 | 10227 | RNAseq | -0.0605 | 0.8756 | |
| SRP064894 | MFSD10 | 10227 | RNAseq | 1.2669 | 0.0001 | |
| SRP133303 | MFSD10 | 10227 | RNAseq | 0.4536 | 0.0780 | |
| SRP159526 | MFSD10 | 10227 | RNAseq | 0.5674 | 0.1876 | |
| SRP193095 | MFSD10 | 10227 | RNAseq | 0.5339 | 0.0008 | |
| SRP219564 | MFSD10 | 10227 | RNAseq | 0.6764 | 0.0913 | |
| TCGA | MFSD10 | 10227 | RNAseq | 0.1087 | 0.1001 |
Upregulated datasets: 1; Downregulated datasets: 0.
Survival by MFSD10 expression:
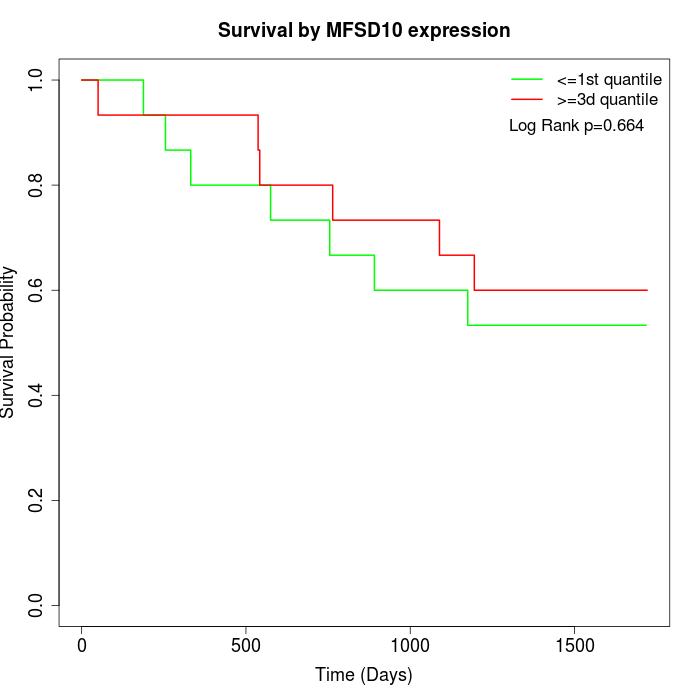 | 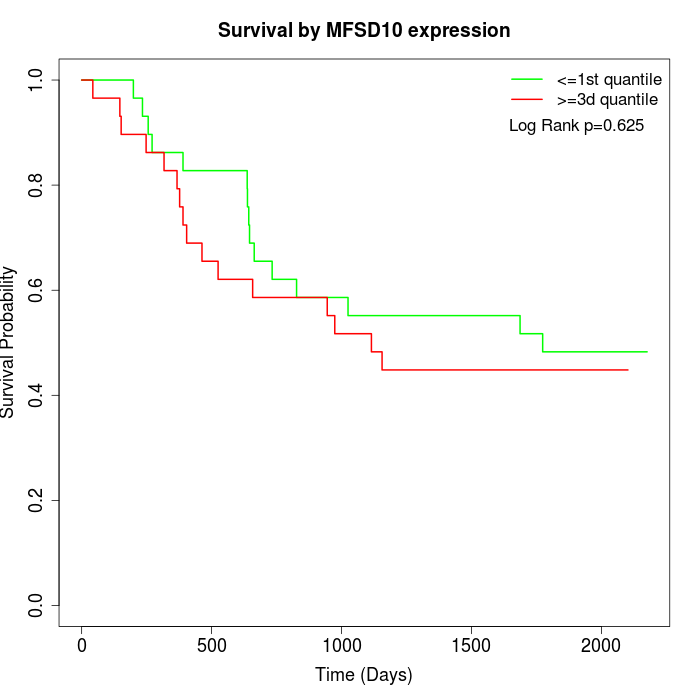 | 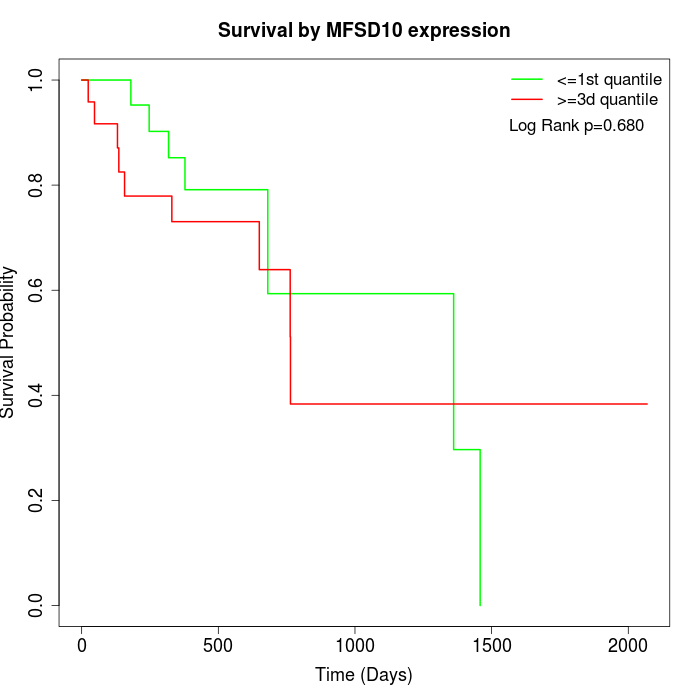 |
| GSE53622 | GSE53624 | TCGA |
Note: Click image to view full size file.
Copy number change of MFSD10:
| Dataset | Gene | EntrezID | Gain | Loss | Normal | Detail |
|---|---|---|---|---|---|---|
| GSE15526 | MFSD10 | 10227 | 0 | 16 | 14 | |
| GSE20123 | MFSD10 | 10227 | 0 | 16 | 14 | |
| GSE43470 | MFSD10 | 10227 | 0 | 17 | 26 | |
| GSE46452 | MFSD10 | 10227 | 1 | 36 | 22 | |
| GSE47630 | MFSD10 | 10227 | 1 | 19 | 20 | |
| GSE54993 | MFSD10 | 10227 | 10 | 0 | 60 | |
| GSE54994 | MFSD10 | 10227 | 3 | 12 | 38 | |
| GSE60625 | MFSD10 | 10227 | 0 | 0 | 11 | |
| GSE74703 | MFSD10 | 10227 | 0 | 13 | 23 | |
| GSE74704 | MFSD10 | 10227 | 0 | 8 | 12 | |
| TCGA | MFSD10 | 10227 | 7 | 48 | 41 |
Total number of gains: 22; Total number of losses: 185; Total Number of normals: 281.
Somatic mutations of MFSD10:
Generating mutation plots.
Highly correlated genes for MFSD10:
Showing top 20/401 corelated genes with mean PCC>0.5.
| Gene1 | Gene2 | Mean PCC | Num. Datasets | Num. PCC<0 | Num. PCC>0.5 |
|---|---|---|---|---|---|
| MFSD10 | GPRIN1 | 0.776985 | 4 | 0 | 4 |
| MFSD10 | XRCC2 | 0.726496 | 3 | 0 | 3 |
| MFSD10 | SIGIRR | 0.72356 | 3 | 0 | 3 |
| MFSD10 | P4HA2 | 0.716119 | 3 | 0 | 3 |
| MFSD10 | ARHGEF1 | 0.715862 | 3 | 0 | 3 |
| MFSD10 | COL27A1 | 0.707252 | 6 | 0 | 5 |
| MFSD10 | HOMER1 | 0.704347 | 4 | 0 | 3 |
| MFSD10 | SALL4 | 0.699165 | 5 | 0 | 5 |
| MFSD10 | RFX8 | 0.695855 | 3 | 0 | 3 |
| MFSD10 | TONSL | 0.690791 | 5 | 0 | 4 |
| MFSD10 | HAUS5 | 0.685292 | 3 | 0 | 3 |
| MFSD10 | PLEC | 0.681994 | 5 | 0 | 4 |
| MFSD10 | CC2D1B | 0.681135 | 3 | 0 | 3 |
| MFSD10 | MYO10 | 0.679497 | 5 | 0 | 4 |
| MFSD10 | DMP1 | 0.678881 | 4 | 0 | 4 |
| MFSD10 | QPRT | 0.678377 | 3 | 0 | 3 |
| MFSD10 | TTPAL | 0.678116 | 5 | 0 | 4 |
| MFSD10 | MARVELD3 | 0.677622 | 3 | 0 | 3 |
| MFSD10 | FBXO22 | 0.672505 | 3 | 0 | 3 |
| MFSD10 | TRIM46 | 0.672095 | 4 | 0 | 3 |
For details and further investigation, click here