| Full name: metabolism of cobalamin associated B | Alias Symbol: cblB|CFAP23 | ||
| Type: protein-coding gene | Cytoband: 12q24.11 | ||
| Entrez ID: 326625 | HGNC ID: HGNC:19331 | Ensembl Gene: ENSG00000139428 | OMIM ID: 607568 |
| Drug and gene relationship at DGIdb | |||
Expression of MMAB:
| Dataset | Gene | EntrezID | Probe | Log2FC | Adj.pValue | Expression |
|---|---|---|---|---|---|---|
| GSE17351 | MMAB | 326625 | 225826_at | -0.0095 | 0.9925 | |
| GSE26886 | MMAB | 326625 | 225826_at | -0.1705 | 0.3796 | |
| GSE45670 | MMAB | 326625 | 225826_at | -0.0815 | 0.6445 | |
| GSE53622 | MMAB | 326625 | 47085 | -1.0321 | 0.0000 | |
| GSE53624 | MMAB | 326625 | 47085 | -0.6045 | 0.0000 | |
| GSE63941 | MMAB | 326625 | 225826_at | 0.5869 | 0.1675 | |
| GSE77861 | MMAB | 326625 | 225826_at | -0.3348 | 0.1042 | |
| SRP007169 | MMAB | 326625 | RNAseq | -0.6765 | 0.0366 | |
| SRP008496 | MMAB | 326625 | RNAseq | -0.7256 | 0.0004 | |
| SRP064894 | MMAB | 326625 | RNAseq | -0.1935 | 0.5411 | |
| SRP133303 | MMAB | 326625 | RNAseq | -0.0103 | 0.9679 | |
| SRP159526 | MMAB | 326625 | RNAseq | 0.1346 | 0.5331 | |
| SRP193095 | MMAB | 326625 | RNAseq | -0.4504 | 0.0012 | |
| SRP219564 | MMAB | 326625 | RNAseq | -0.3784 | 0.2858 | |
| TCGA | MMAB | 326625 | RNAseq | 0.0277 | 0.6631 |
Upregulated datasets: 0; Downregulated datasets: 1.
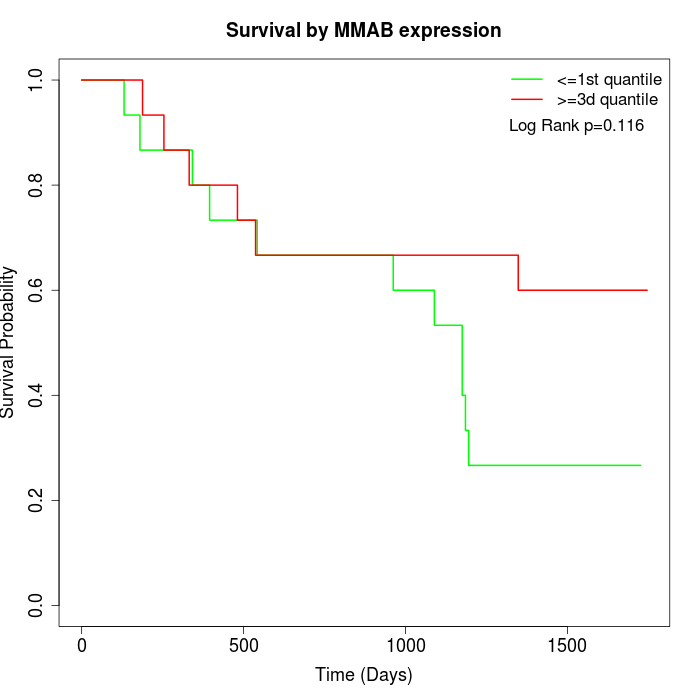
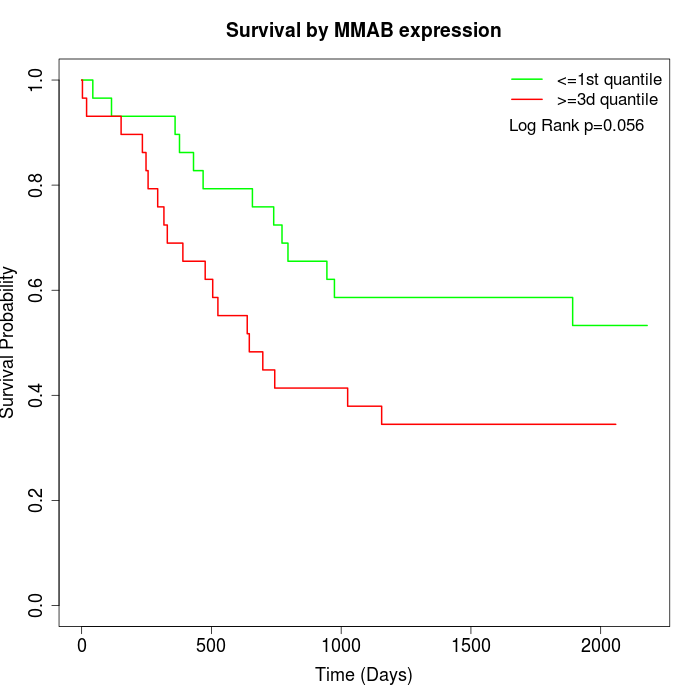
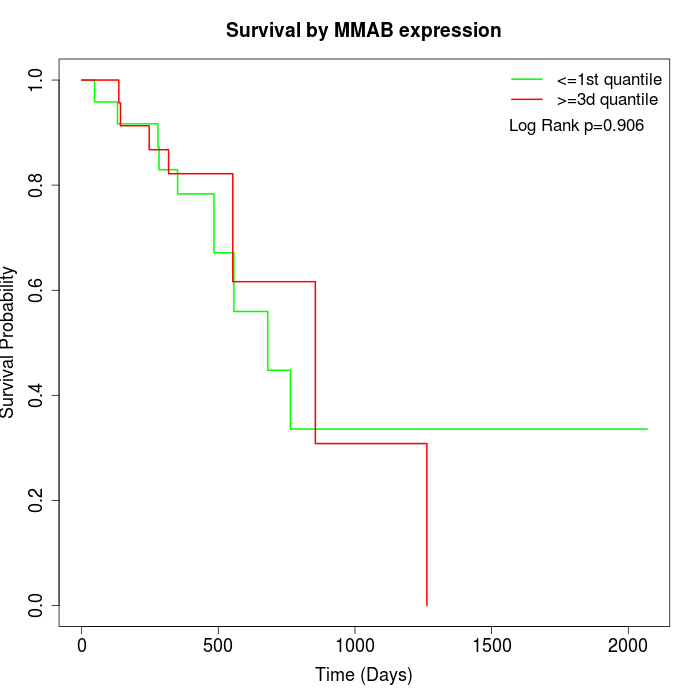
Survival by MMAB expression:
Note: Click image to view full size file.
Copy number change of MMAB:
| Dataset | Gene | EntrezID | Gain | Loss | Normal | Detail |
|---|---|---|---|---|---|---|
| GSE15526 | MMAB | 326625 | 5 | 3 | 22 | |
| GSE20123 | MMAB | 326625 | 5 | 4 | 21 | |
| GSE43470 | MMAB | 326625 | 2 | 1 | 40 | |
| GSE46452 | MMAB | 326625 | 9 | 1 | 49 | |
| GSE47630 | MMAB | 326625 | 9 | 1 | 30 | |
| GSE54993 | MMAB | 326625 | 0 | 5 | 65 | |
| GSE54994 | MMAB | 326625 | 4 | 3 | 46 | |
| GSE60625 | MMAB | 326625 | 0 | 0 | 11 | |
| GSE74703 | MMAB | 326625 | 2 | 0 | 34 | |
| GSE74704 | MMAB | 326625 | 2 | 2 | 16 | |
| TCGA | MMAB | 326625 | 21 | 10 | 65 |
Total number of gains: 59; Total number of losses: 30; Total Number of normals: 399.
Somatic mutations of MMAB:
Generating mutation plots.
Highly correlated genes for MMAB:
Showing top 20/98 corelated genes with mean PCC>0.5.
| Gene1 | Gene2 | Mean PCC | Num. Datasets | Num. PCC<0 | Num. PCC>0.5 |
|---|---|---|---|---|---|
| MMAB | AKR7A3 | 0.728652 | 3 | 0 | 3 |
| MMAB | JMJD8 | 0.699472 | 3 | 0 | 3 |
| MMAB | RIPK4 | 0.687991 | 3 | 0 | 3 |
| MMAB | TOLLIP | 0.682588 | 3 | 0 | 3 |
| MMAB | GLTP | 0.666849 | 3 | 0 | 3 |
| MMAB | TACSTD2 | 0.657296 | 3 | 0 | 3 |
| MMAB | MUC4 | 0.639156 | 3 | 0 | 3 |
| MMAB | LSS | 0.632998 | 4 | 0 | 3 |
| MMAB | MID2 | 0.624529 | 4 | 0 | 4 |
| MMAB | EVPLL | 0.624192 | 3 | 0 | 3 |
| MMAB | PRRG4 | 0.619054 | 3 | 0 | 3 |
| MMAB | PANK1 | 0.613233 | 3 | 0 | 3 |
| MMAB | HCAR3 | 0.610485 | 3 | 0 | 3 |
| MMAB | AKAP7 | 0.609156 | 3 | 0 | 3 |
| MMAB | EPHA1 | 0.608287 | 5 | 0 | 3 |
| MMAB | WHAMM | 0.607711 | 3 | 0 | 3 |
| MMAB | SLC9A3R1 | 0.602569 | 4 | 0 | 4 |
| MMAB | FUT3 | 0.597638 | 3 | 0 | 3 |
| MMAB | VSNL1 | 0.594023 | 3 | 0 | 3 |
| MMAB | MVK | 0.589679 | 4 | 0 | 3 |
For details and further investigation, click here


