| Full name: tumor associated calcium signal transducer 2 | Alias Symbol: TROP2|GA733-1|EGP-1 | ||
| Type: protein-coding gene | Cytoband: 1p32.1 | ||
| Entrez ID: 4070 | HGNC ID: HGNC:11530 | Ensembl Gene: ENSG00000184292 | OMIM ID: 137290 |
| Related drugs: SACITUZUMAB GOVITECAN... [more] | |||
Expression of TACSTD2:
| Dataset | Gene | EntrezID | Probe | Log2FC | Adj.pValue | Expression |
|---|---|---|---|---|---|---|
| GSE17351 | TACSTD2 | 4070 | 202286_s_at | -0.3710 | 0.5124 | |
| GSE20347 | TACSTD2 | 4070 | 202286_s_at | -0.7559 | 0.0001 | |
| GSE23400 | TACSTD2 | 4070 | 202286_s_at | -0.7584 | 0.0000 | |
| GSE26886 | TACSTD2 | 4070 | 202286_s_at | -0.6819 | 0.0003 | |
| GSE29001 | TACSTD2 | 4070 | 202286_s_at | -0.6957 | 0.0610 | |
| GSE38129 | TACSTD2 | 4070 | 202286_s_at | -0.0196 | 0.9823 | |
| GSE45670 | TACSTD2 | 4070 | 202286_s_at | -0.1539 | 0.2823 | |
| GSE53622 | TACSTD2 | 4070 | 34994 | -1.0488 | 0.0001 | |
| GSE53624 | TACSTD2 | 4070 | 34994 | -1.7406 | 0.0000 | |
| GSE63941 | TACSTD2 | 4070 | 202286_s_at | 6.1709 | 0.0058 | |
| GSE77861 | TACSTD2 | 4070 | 202286_s_at | -0.4464 | 0.0065 | |
| GSE97050 | TACSTD2 | 4070 | A_23_P149529 | 0.7025 | 0.6774 | |
| SRP007169 | TACSTD2 | 4070 | RNAseq | -2.7754 | 0.0000 | |
| SRP008496 | TACSTD2 | 4070 | RNAseq | -3.1877 | 0.0000 | |
| SRP064894 | TACSTD2 | 4070 | RNAseq | -1.5753 | 0.0005 | |
| SRP133303 | TACSTD2 | 4070 | RNAseq | -1.6913 | 0.0000 | |
| SRP159526 | TACSTD2 | 4070 | RNAseq | -2.5238 | 0.0000 | |
| SRP193095 | TACSTD2 | 4070 | RNAseq | -1.3766 | 0.0000 | |
| SRP219564 | TACSTD2 | 4070 | RNAseq | -2.0808 | 0.0541 | |
| TCGA | TACSTD2 | 4070 | RNAseq | 0.7175 | 0.0000 |
Upregulated datasets: 1; Downregulated datasets: 8.
Survival by TACSTD2 expression:
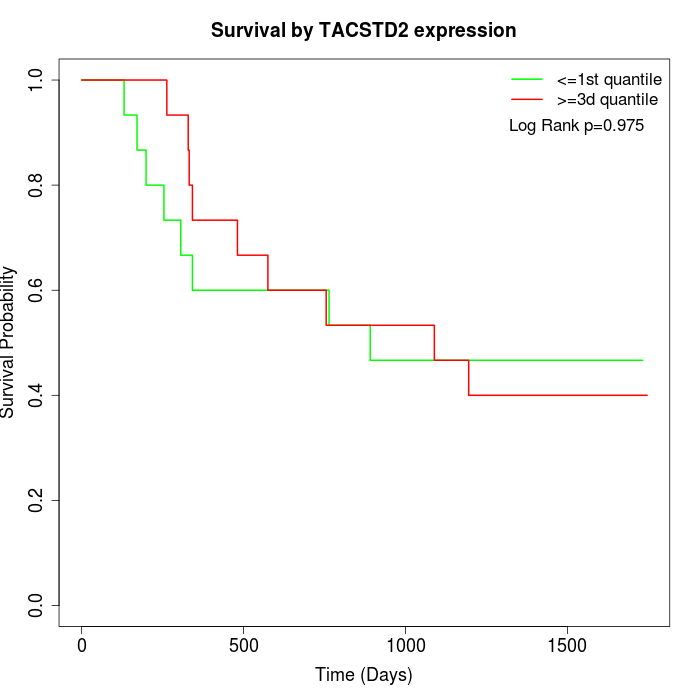 | 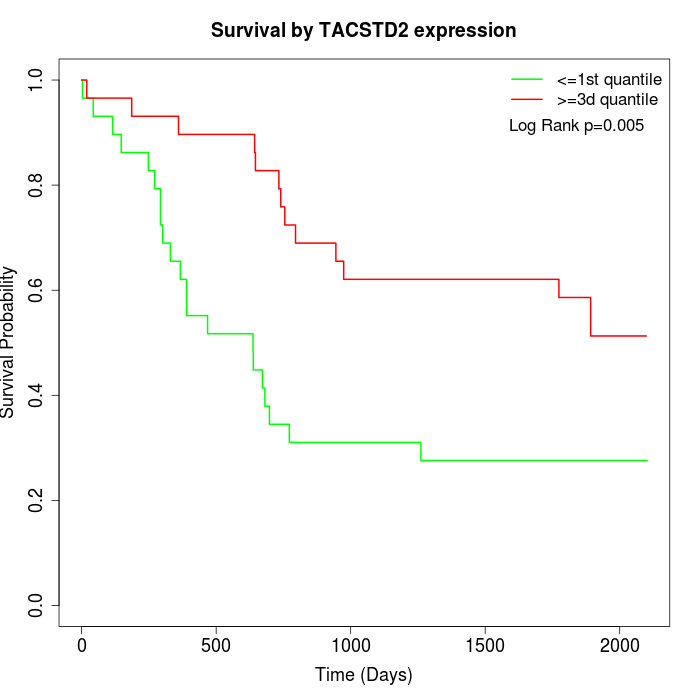 | 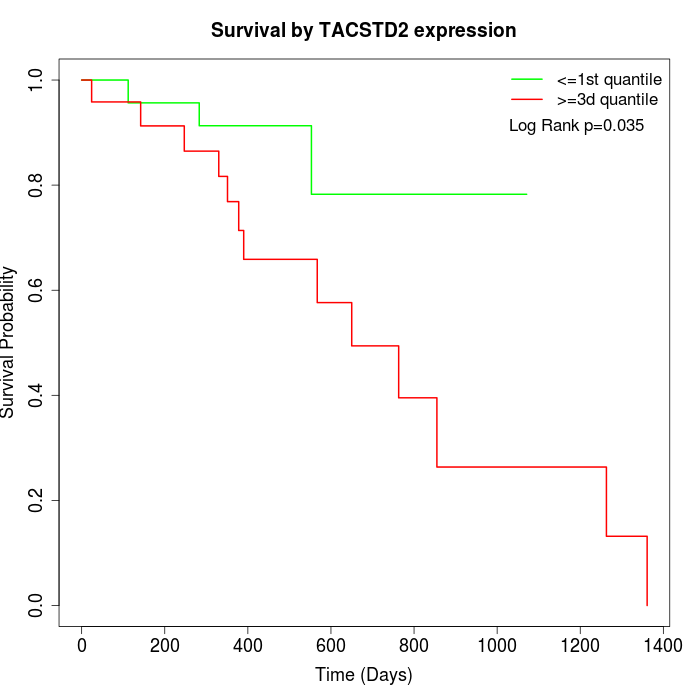 |
| GSE53622 | GSE53624 | TCGA |
Note: Click image to view full size file.
Copy number change of TACSTD2:
| Dataset | Gene | EntrezID | Gain | Loss | Normal | Detail |
|---|---|---|---|---|---|---|
| GSE15526 | TACSTD2 | 4070 | 3 | 4 | 23 | |
| GSE20123 | TACSTD2 | 4070 | 3 | 3 | 24 | |
| GSE43470 | TACSTD2 | 4070 | 7 | 2 | 34 | |
| GSE46452 | TACSTD2 | 4070 | 2 | 1 | 56 | |
| GSE47630 | TACSTD2 | 4070 | 8 | 5 | 27 | |
| GSE54993 | TACSTD2 | 4070 | 0 | 0 | 70 | |
| GSE54994 | TACSTD2 | 4070 | 8 | 2 | 43 | |
| GSE60625 | TACSTD2 | 4070 | 0 | 0 | 11 | |
| GSE74703 | TACSTD2 | 4070 | 6 | 2 | 28 | |
| GSE74704 | TACSTD2 | 4070 | 2 | 0 | 18 | |
| TCGA | TACSTD2 | 4070 | 10 | 18 | 68 |
Total number of gains: 49; Total number of losses: 37; Total Number of normals: 402.
Somatic mutations of TACSTD2:
Generating mutation plots.
Highly correlated genes for TACSTD2:
Showing top 20/1018 corelated genes with mean PCC>0.5.
| Gene1 | Gene2 | Mean PCC | Num. Datasets | Num. PCC<0 | Num. PCC>0.5 |
|---|---|---|---|---|---|
| TACSTD2 | MACC1 | 0.787703 | 8 | 0 | 8 |
| TACSTD2 | CLDN4 | 0.771061 | 9 | 0 | 9 |
| TACSTD2 | ANXA1 | 0.76317 | 12 | 0 | 11 |
| TACSTD2 | RIPK4 | 0.758121 | 10 | 0 | 10 |
| TACSTD2 | C6orf132 | 0.755784 | 8 | 0 | 8 |
| TACSTD2 | HCAR3 | 0.752149 | 10 | 0 | 10 |
| TACSTD2 | EVPL | 0.742569 | 12 | 0 | 12 |
| TACSTD2 | ELF3 | 0.74208 | 13 | 0 | 13 |
| TACSTD2 | IL1RN | 0.741266 | 13 | 0 | 12 |
| TACSTD2 | MFSD11 | 0.740923 | 3 | 0 | 3 |
| TACSTD2 | TMEM154 | 0.735188 | 8 | 0 | 7 |
| TACSTD2 | BTBD11 | 0.73425 | 7 | 0 | 7 |
| TACSTD2 | RHBDL2 | 0.732508 | 8 | 0 | 8 |
| TACSTD2 | S100A14 | 0.730217 | 13 | 0 | 12 |
| TACSTD2 | MPZL2 | 0.721228 | 13 | 0 | 12 |
| TACSTD2 | CEACAM6 | 0.71983 | 12 | 0 | 10 |
| TACSTD2 | ARHGAP40 | 0.719512 | 3 | 0 | 3 |
| TACSTD2 | C1orf116 | 0.718347 | 13 | 0 | 12 |
| TACSTD2 | S100A16 | 0.71795 | 9 | 0 | 8 |
| TACSTD2 | OTOP3 | 0.716838 | 3 | 0 | 3 |
For details and further investigation, click here