| Full name: MMS19 homolog, cytosolic iron-sulfur assembly component | Alias Symbol: MET18|hMMS19|CIAO4 | ||
| Type: protein-coding gene | Cytoband: 10q24.1 | ||
| Entrez ID: 64210 | HGNC ID: HGNC:13824 | Ensembl Gene: ENSG00000155229 | OMIM ID: 614777 |
Screen Evidence:
| |||
Expression of MMS19:
| Dataset | Gene | EntrezID | Probe | Log2FC | Adj.pValue | Expression |
|---|---|---|---|---|---|---|
| GSE17351 | MMS19 | 64210 | 202167_s_at | 0.2679 | 0.3586 | |
| GSE20347 | MMS19 | 64210 | 202167_s_at | -0.2445 | 0.0972 | |
| GSE23400 | MMS19 | 64210 | 202167_s_at | 0.0531 | 0.3447 | |
| GSE26886 | MMS19 | 64210 | 202167_s_at | 0.0264 | 0.9133 | |
| GSE29001 | MMS19 | 64210 | 202167_s_at | -0.1991 | 0.4494 | |
| GSE38129 | MMS19 | 64210 | 202167_s_at | -0.0244 | 0.8559 | |
| GSE45670 | MMS19 | 64210 | 202167_s_at | -0.0245 | 0.8580 | |
| GSE53622 | MMS19 | 64210 | 35737 | 0.3201 | 0.0000 | |
| GSE53624 | MMS19 | 64210 | 12554 | 0.0886 | 0.2935 | |
| GSE63941 | MMS19 | 64210 | 202167_s_at | 0.7838 | 0.0118 | |
| GSE77861 | MMS19 | 64210 | 202167_s_at | -0.0846 | 0.7452 | |
| GSE97050 | MMS19 | 64210 | A_23_P46982 | 0.0074 | 0.9780 | |
| SRP007169 | MMS19 | 64210 | RNAseq | -0.5056 | 0.1218 | |
| SRP008496 | MMS19 | 64210 | RNAseq | -0.4393 | 0.0180 | |
| SRP064894 | MMS19 | 64210 | RNAseq | 0.1214 | 0.2546 | |
| SRP133303 | MMS19 | 64210 | RNAseq | -0.0602 | 0.6408 | |
| SRP159526 | MMS19 | 64210 | RNAseq | -0.2963 | 0.1062 | |
| SRP193095 | MMS19 | 64210 | RNAseq | 0.0142 | 0.8786 | |
| SRP219564 | MMS19 | 64210 | RNAseq | 0.1059 | 0.7805 | |
| TCGA | MMS19 | 64210 | RNAseq | 0.0711 | 0.1427 |
Upregulated datasets: 0; Downregulated datasets: 0.
Survival by MMS19 expression:
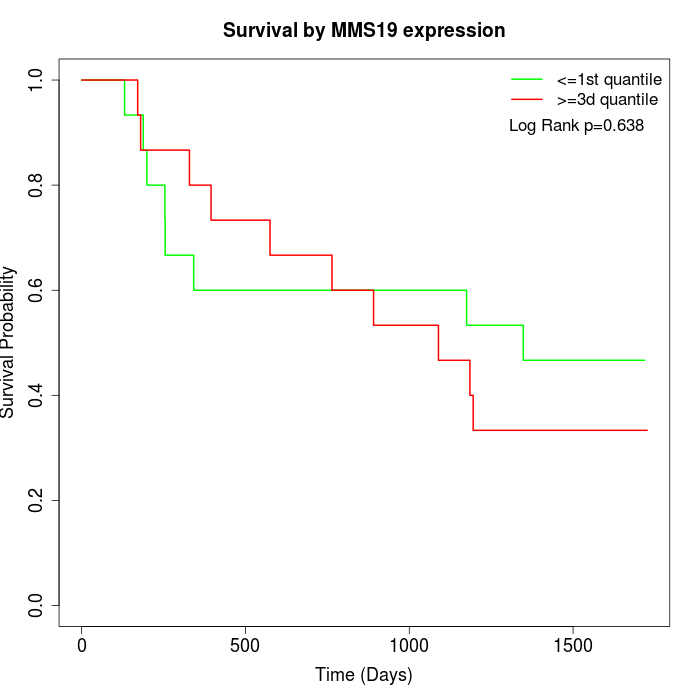 | 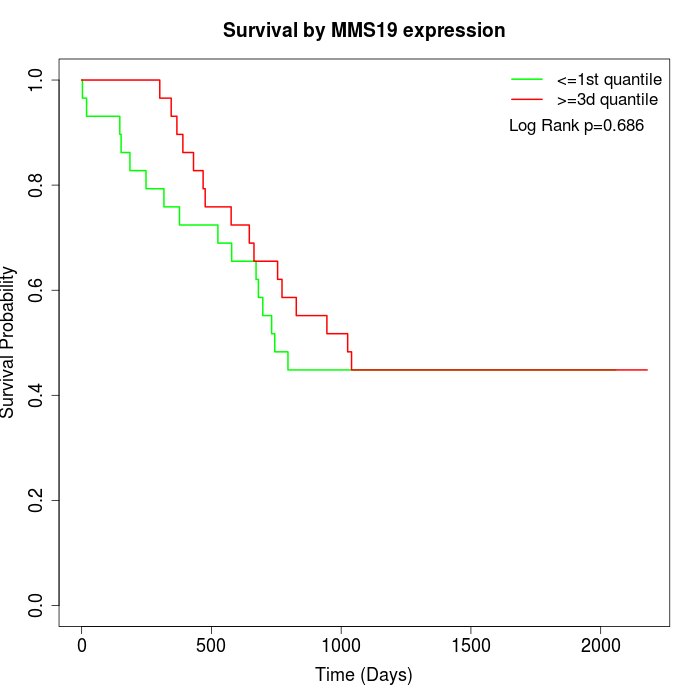 | 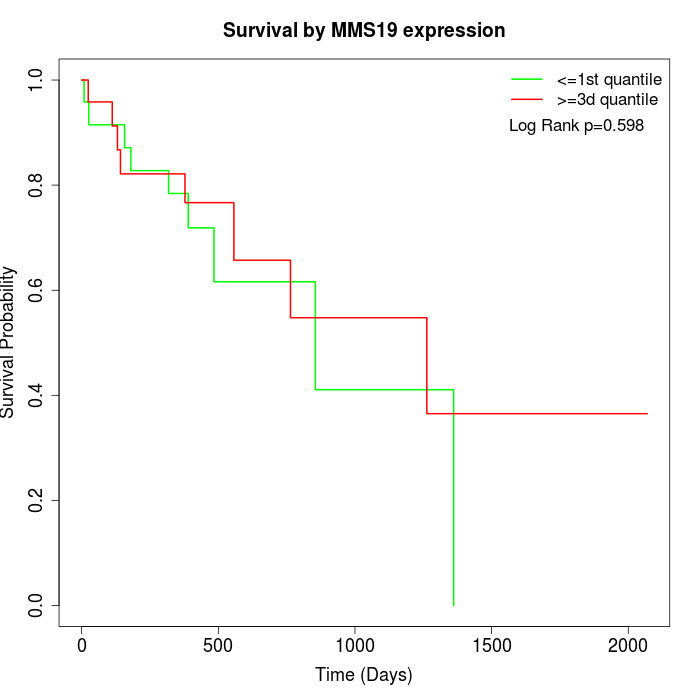 |
| GSE53622 | GSE53624 | TCGA |
Note: Click image to view full size file.
Copy number change of MMS19:
| Dataset | Gene | EntrezID | Gain | Loss | Normal | Detail |
|---|---|---|---|---|---|---|
| GSE15526 | MMS19 | 64210 | 0 | 8 | 22 | |
| GSE20123 | MMS19 | 64210 | 0 | 7 | 23 | |
| GSE43470 | MMS19 | 64210 | 0 | 7 | 36 | |
| GSE46452 | MMS19 | 64210 | 0 | 11 | 48 | |
| GSE47630 | MMS19 | 64210 | 2 | 14 | 24 | |
| GSE54993 | MMS19 | 64210 | 8 | 0 | 62 | |
| GSE54994 | MMS19 | 64210 | 2 | 10 | 41 | |
| GSE60625 | MMS19 | 64210 | 0 | 0 | 11 | |
| GSE74703 | MMS19 | 64210 | 0 | 5 | 31 | |
| GSE74704 | MMS19 | 64210 | 0 | 4 | 16 | |
| TCGA | MMS19 | 64210 | 5 | 28 | 63 |
Total number of gains: 17; Total number of losses: 94; Total Number of normals: 377.
Somatic mutations of MMS19:
Generating mutation plots.
Highly correlated genes for MMS19:
Showing top 20/454 corelated genes with mean PCC>0.5.
| Gene1 | Gene2 | Mean PCC | Num. Datasets | Num. PCC<0 | Num. PCC>0.5 |
|---|---|---|---|---|---|
| MMS19 | HSPB11 | 0.823553 | 3 | 0 | 3 |
| MMS19 | C1orf112 | 0.790336 | 3 | 0 | 3 |
| MMS19 | NAP1L4 | 0.789502 | 3 | 0 | 3 |
| MMS19 | TAF1C | 0.783902 | 3 | 0 | 3 |
| MMS19 | MRPS9 | 0.758862 | 3 | 0 | 3 |
| MMS19 | GPBP1 | 0.746846 | 3 | 0 | 3 |
| MMS19 | ZNF557 | 0.742594 | 3 | 0 | 3 |
| MMS19 | PDRG1 | 0.741242 | 3 | 0 | 3 |
| MMS19 | STARD10 | 0.731369 | 3 | 0 | 3 |
| MMS19 | ZBTB11 | 0.731192 | 3 | 0 | 3 |
| MMS19 | RPA1 | 0.725856 | 3 | 0 | 3 |
| MMS19 | CHERP | 0.723646 | 3 | 0 | 3 |
| MMS19 | DSCC1 | 0.722511 | 3 | 0 | 3 |
| MMS19 | CNOT10 | 0.721615 | 3 | 0 | 3 |
| MMS19 | C20orf27 | 0.721593 | 3 | 0 | 3 |
| MMS19 | TRIM62 | 0.721408 | 3 | 0 | 3 |
| MMS19 | TMEM51 | 0.71762 | 3 | 0 | 3 |
| MMS19 | ERCC6 | 0.716254 | 3 | 0 | 3 |
| MMS19 | C12orf73 | 0.71202 | 3 | 0 | 3 |
| MMS19 | TMEM63B | 0.711308 | 3 | 0 | 3 |
For details and further investigation, click here