| Full name: MOB kinase activator 2 | Alias Symbol: HCCA2 | ||
| Type: protein-coding gene | Cytoband: 11p15.5 | ||
| Entrez ID: 81532 | HGNC ID: HGNC:24904 | Ensembl Gene: ENSG00000182208 | OMIM ID: 611969 |
Expression of MOB2:
| Dataset | Gene | EntrezID | Probe | Log2FC | Adj.pValue | Expression |
|---|---|---|---|---|---|---|
| GSE17351 | MOB2 | 81532 | 223353_at | -0.6456 | 0.0701 | |
| GSE26886 | MOB2 | 81532 | 223353_at | -0.5852 | 0.0003 | |
| GSE45670 | MOB2 | 81532 | 223353_at | -0.1945 | 0.2187 | |
| GSE53622 | MOB2 | 81532 | 47454 | -0.6006 | 0.0000 | |
| GSE53624 | MOB2 | 81532 | 47454 | -0.4694 | 0.0000 | |
| GSE63941 | MOB2 | 81532 | 223353_at | -0.1387 | 0.7340 | |
| GSE77861 | MOB2 | 81532 | 223353_at | -0.2057 | 0.2798 | |
| GSE97050 | MOB2 | 81532 | A_23_P64499 | -0.4888 | 0.2857 | |
| SRP007169 | MOB2 | 81532 | RNAseq | -0.9909 | 0.0546 | |
| SRP008496 | MOB2 | 81532 | RNAseq | -0.9256 | 0.0057 | |
| SRP064894 | MOB2 | 81532 | RNAseq | -0.6351 | 0.0131 | |
| SRP133303 | MOB2 | 81532 | RNAseq | -0.6261 | 0.0017 | |
| SRP159526 | MOB2 | 81532 | RNAseq | -0.9370 | 0.0000 | |
| SRP193095 | MOB2 | 81532 | RNAseq | -0.5716 | 0.0000 | |
| SRP219564 | MOB2 | 81532 | RNAseq | -0.5106 | 0.3600 | |
| TCGA | MOB2 | 81532 | RNAseq | -0.1166 | 0.0552 |
Upregulated datasets: 0; Downregulated datasets: 0.
Survival by MOB2 expression:
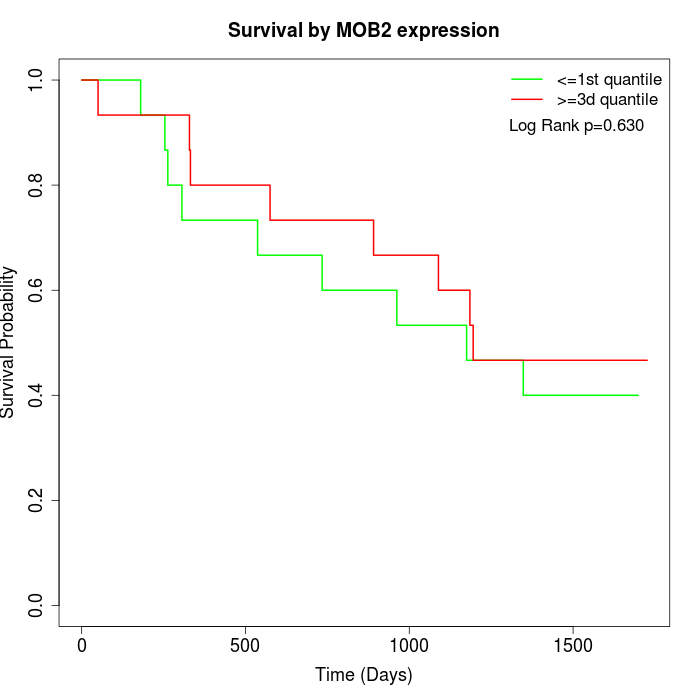 | 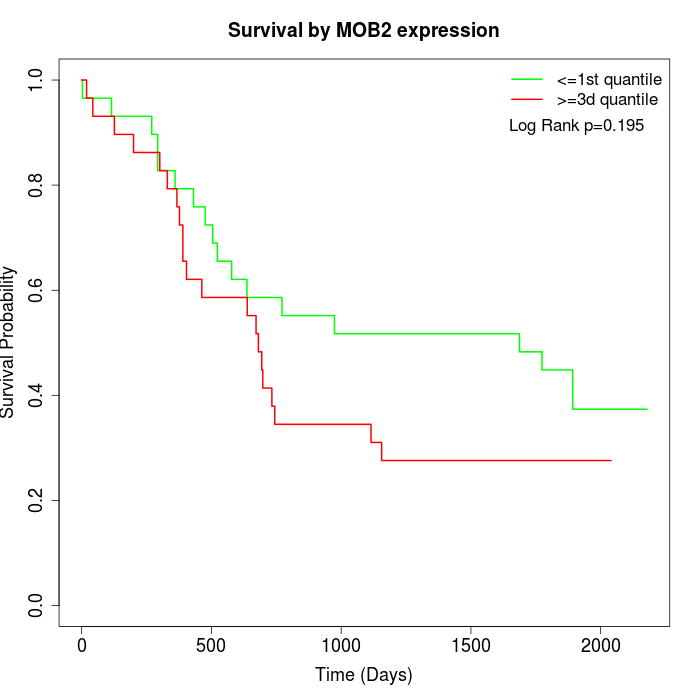 | 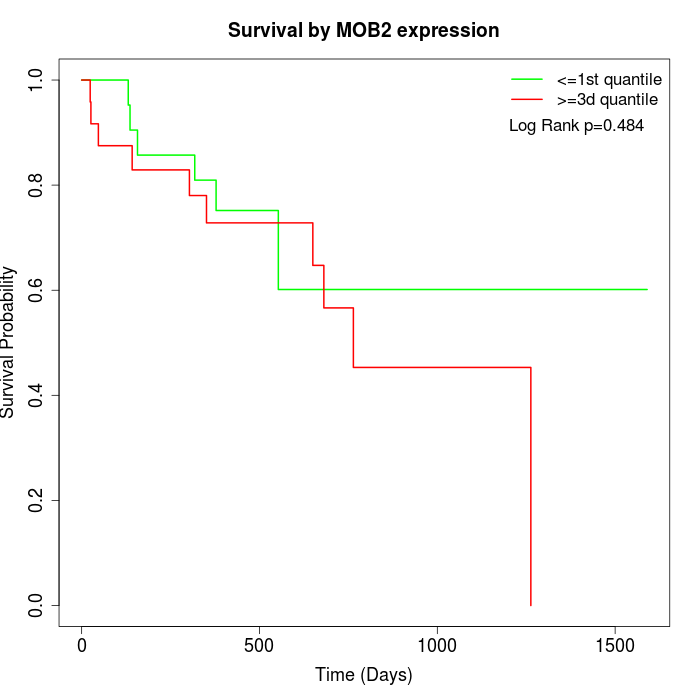 |
| GSE53622 | GSE53624 | TCGA |
Note: Click image to view full size file.
Copy number change of MOB2:
| Dataset | Gene | EntrezID | Gain | Loss | Normal | Detail |
|---|---|---|---|---|---|---|
| GSE15526 | MOB2 | 81532 | 1 | 11 | 18 | |
| GSE20123 | MOB2 | 81532 | 1 | 12 | 17 | |
| GSE43470 | MOB2 | 81532 | 1 | 10 | 32 | |
| GSE46452 | MOB2 | 81532 | 7 | 8 | 44 | |
| GSE47630 | MOB2 | 81532 | 4 | 12 | 24 | |
| GSE54993 | MOB2 | 81532 | 3 | 1 | 66 | |
| GSE54994 | MOB2 | 81532 | 1 | 12 | 40 | |
| GSE60625 | MOB2 | 81532 | 0 | 0 | 11 | |
| GSE74703 | MOB2 | 81532 | 1 | 8 | 27 | |
| GSE74704 | MOB2 | 81532 | 0 | 8 | 12 | |
| TCGA | MOB2 | 81532 | 8 | 39 | 49 |
Total number of gains: 27; Total number of losses: 121; Total Number of normals: 340.
Somatic mutations of MOB2:
Generating mutation plots.
Highly correlated genes for MOB2:
Showing top 20/400 corelated genes with mean PCC>0.5.
| Gene1 | Gene2 | Mean PCC | Num. Datasets | Num. PCC<0 | Num. PCC>0.5 |
|---|---|---|---|---|---|
| MOB2 | KCNK3 | 0.758981 | 3 | 0 | 3 |
| MOB2 | FAT4 | 0.741714 | 3 | 0 | 3 |
| MOB2 | GKAP1 | 0.737747 | 3 | 0 | 3 |
| MOB2 | SH3BGR | 0.735117 | 3 | 0 | 3 |
| MOB2 | FGF14 | 0.732567 | 4 | 0 | 4 |
| MOB2 | NPR1 | 0.730303 | 4 | 0 | 4 |
| MOB2 | RHOV | 0.729942 | 3 | 0 | 3 |
| MOB2 | LY6H | 0.728145 | 3 | 0 | 3 |
| MOB2 | RNH1 | 0.7263 | 7 | 0 | 7 |
| MOB2 | NEGR1 | 0.722037 | 3 | 0 | 3 |
| MOB2 | VIPR2 | 0.721022 | 3 | 0 | 3 |
| MOB2 | NDUFS7 | 0.717474 | 3 | 0 | 3 |
| MOB2 | UBXN6 | 0.717218 | 3 | 0 | 3 |
| MOB2 | ARHGAP6 | 0.710726 | 3 | 0 | 3 |
| MOB2 | PDE2A | 0.710135 | 3 | 0 | 3 |
| MOB2 | TMED3 | 0.709014 | 3 | 0 | 3 |
| MOB2 | DACT3 | 0.705835 | 4 | 0 | 3 |
| MOB2 | ITGA7 | 0.702031 | 3 | 0 | 3 |
| MOB2 | TMEM114 | 0.698753 | 3 | 0 | 3 |
| MOB2 | HRCT1 | 0.698279 | 4 | 0 | 4 |
For details and further investigation, click here