| Full name: M-phase phosphoprotein 10 | Alias Symbol: MPP10|MPP10P|CT90|PPP1R106 | ||
| Type: protein-coding gene | Cytoband: 2p13.3 | ||
| Entrez ID: 10199 | HGNC ID: HGNC:7213 | Ensembl Gene: ENSG00000124383 | OMIM ID: 605503 |
Screen Evidence:
| |||
Expression of MPHOSPH10:
| Dataset | Gene | EntrezID | Probe | Log2FC | Adj.pValue | Expression |
|---|---|---|---|---|---|---|
| GSE17351 | MPHOSPH10 | 10199 | 212885_at | -0.1005 | 0.8273 | |
| GSE20347 | MPHOSPH10 | 10199 | 212885_at | -0.1228 | 0.2059 | |
| GSE23400 | MPHOSPH10 | 10199 | 212885_at | 0.0129 | 0.8444 | |
| GSE26886 | MPHOSPH10 | 10199 | 212885_at | 0.2696 | 0.1362 | |
| GSE29001 | MPHOSPH10 | 10199 | 212885_at | -0.1928 | 0.6610 | |
| GSE38129 | MPHOSPH10 | 10199 | 212885_at | 0.1140 | 0.3735 | |
| GSE45670 | MPHOSPH10 | 10199 | 212885_at | -0.0484 | 0.7525 | |
| GSE53622 | MPHOSPH10 | 10199 | 14994 | -0.1709 | 0.0046 | |
| GSE53624 | MPHOSPH10 | 10199 | 14994 | -0.1983 | 0.0000 | |
| GSE63941 | MPHOSPH10 | 10199 | 212885_at | -0.5297 | 0.1715 | |
| GSE77861 | MPHOSPH10 | 10199 | 212885_at | -0.0919 | 0.6570 | |
| GSE97050 | MPHOSPH10 | 10199 | A_23_P5586 | -0.0688 | 0.8072 | |
| SRP007169 | MPHOSPH10 | 10199 | RNAseq | 0.7073 | 0.2038 | |
| SRP008496 | MPHOSPH10 | 10199 | RNAseq | 0.6701 | 0.0814 | |
| SRP064894 | MPHOSPH10 | 10199 | RNAseq | -0.4032 | 0.0093 | |
| SRP133303 | MPHOSPH10 | 10199 | RNAseq | -0.0261 | 0.8550 | |
| SRP159526 | MPHOSPH10 | 10199 | RNAseq | 0.0901 | 0.7072 | |
| SRP193095 | MPHOSPH10 | 10199 | RNAseq | -0.2623 | 0.0651 | |
| SRP219564 | MPHOSPH10 | 10199 | RNAseq | -0.0601 | 0.8925 | |
| TCGA | MPHOSPH10 | 10199 | RNAseq | 0.1220 | 0.0192 |
Upregulated datasets: 0; Downregulated datasets: 0.
Survival by MPHOSPH10 expression:
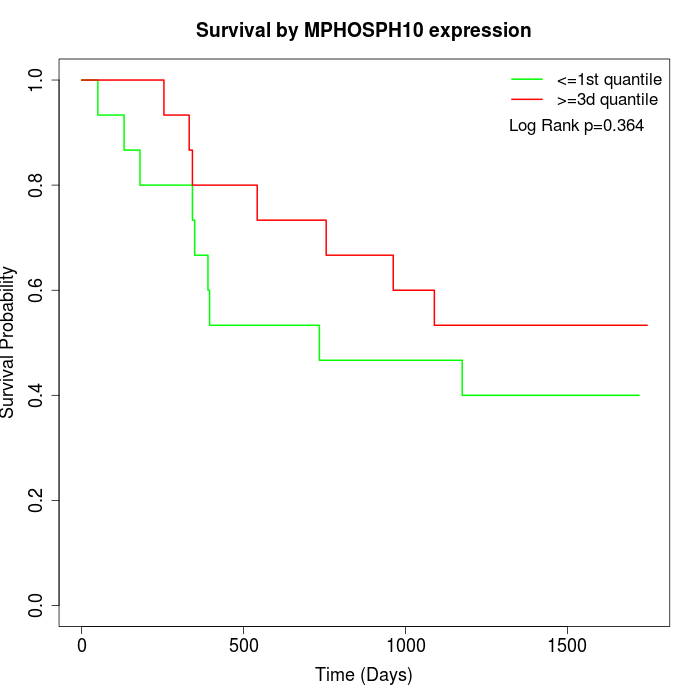 | 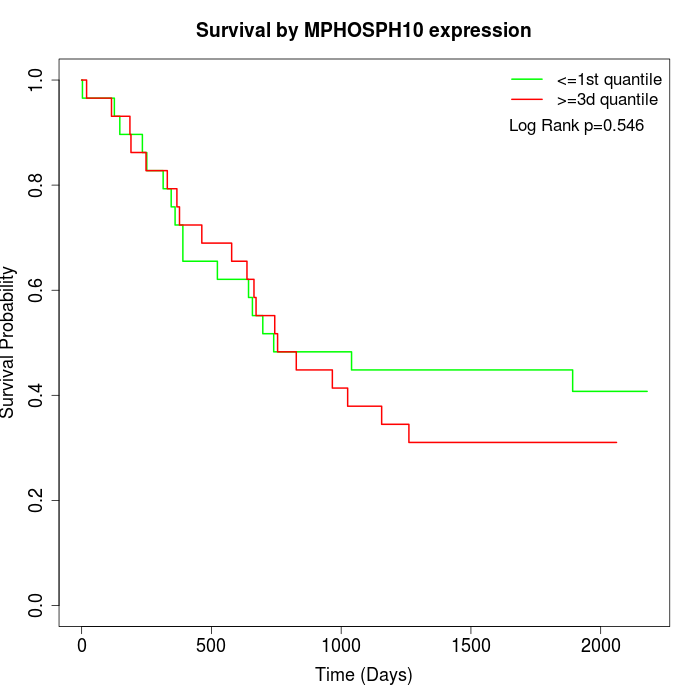 | 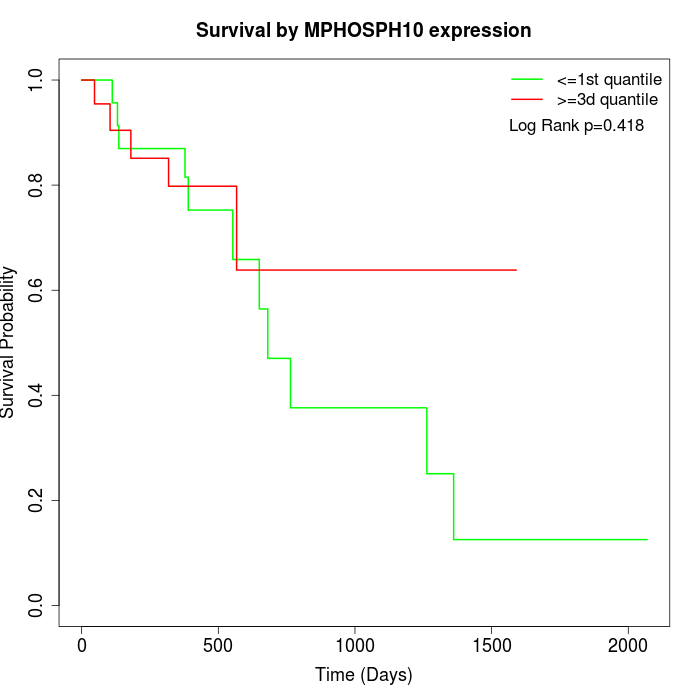 |
| GSE53622 | GSE53624 | TCGA |
Note: Click image to view full size file.
Copy number change of MPHOSPH10:
| Dataset | Gene | EntrezID | Gain | Loss | Normal | Detail |
|---|---|---|---|---|---|---|
| GSE15526 | MPHOSPH10 | 10199 | 11 | 1 | 18 | |
| GSE20123 | MPHOSPH10 | 10199 | 11 | 1 | 18 | |
| GSE43470 | MPHOSPH10 | 10199 | 3 | 0 | 40 | |
| GSE46452 | MPHOSPH10 | 10199 | 2 | 3 | 54 | |
| GSE47630 | MPHOSPH10 | 10199 | 7 | 0 | 33 | |
| GSE54993 | MPHOSPH10 | 10199 | 0 | 6 | 64 | |
| GSE54994 | MPHOSPH10 | 10199 | 11 | 0 | 42 | |
| GSE60625 | MPHOSPH10 | 10199 | 0 | 3 | 8 | |
| GSE74703 | MPHOSPH10 | 10199 | 3 | 0 | 33 | |
| GSE74704 | MPHOSPH10 | 10199 | 9 | 0 | 11 | |
| TCGA | MPHOSPH10 | 10199 | 37 | 2 | 57 |
Total number of gains: 94; Total number of losses: 16; Total Number of normals: 378.
Somatic mutations of MPHOSPH10:
Generating mutation plots.
Highly correlated genes for MPHOSPH10:
Showing top 20/295 corelated genes with mean PCC>0.5.
| Gene1 | Gene2 | Mean PCC | Num. Datasets | Num. PCC<0 | Num. PCC>0.5 |
|---|---|---|---|---|---|
| MPHOSPH10 | RUFY3 | 0.805603 | 3 | 0 | 3 |
| MPHOSPH10 | STAM2 | 0.710522 | 4 | 0 | 3 |
| MPHOSPH10 | ZMPSTE24 | 0.708002 | 3 | 0 | 3 |
| MPHOSPH10 | NPHP3 | 0.707103 | 3 | 0 | 3 |
| MPHOSPH10 | NOL10 | 0.700385 | 3 | 0 | 3 |
| MPHOSPH10 | PLK3 | 0.692056 | 3 | 0 | 3 |
| MPHOSPH10 | ZNF165 | 0.691485 | 4 | 0 | 3 |
| MPHOSPH10 | EIF5B | 0.688079 | 5 | 0 | 5 |
| MPHOSPH10 | ATXN7 | 0.686988 | 4 | 0 | 3 |
| MPHOSPH10 | LARP7 | 0.685385 | 3 | 0 | 3 |
| MPHOSPH10 | BLOC1S2 | 0.67745 | 4 | 0 | 3 |
| MPHOSPH10 | KDM3A | 0.676499 | 4 | 0 | 3 |
| MPHOSPH10 | TRNT1 | 0.675774 | 3 | 0 | 3 |
| MPHOSPH10 | MORN2 | 0.673792 | 3 | 0 | 3 |
| MPHOSPH10 | EP300 | 0.668403 | 3 | 0 | 3 |
| MPHOSPH10 | ZNF638 | 0.667699 | 6 | 0 | 5 |
| MPHOSPH10 | SNAP29 | 0.666384 | 3 | 0 | 3 |
| MPHOSPH10 | SCFD1 | 0.665441 | 4 | 0 | 3 |
| MPHOSPH10 | CCAR1 | 0.665175 | 4 | 0 | 3 |
| MPHOSPH10 | S100A11 | 0.664821 | 3 | 0 | 3 |
For details and further investigation, click here