| Full name: S100 calcium binding protein A11 | Alias Symbol: S100C | ||
| Type: protein-coding gene | Cytoband: 1q21.3 | ||
| Entrez ID: 6282 | HGNC ID: HGNC:10488 | Ensembl Gene: ENSG00000163191 | OMIM ID: 603114 |
Expression of S100A11:
| Dataset | Gene | EntrezID | Probe | Log2FC | Adj.pValue | Expression |
|---|---|---|---|---|---|---|
| GSE17351 | S100A11 | 6282 | 200660_at | -0.1557 | 0.7860 | |
| GSE20347 | S100A11 | 6282 | 200660_at | -0.6792 | 0.0000 | |
| GSE23400 | S100A11 | 6282 | 200660_at | -0.3148 | 0.0002 | |
| GSE26886 | S100A11 | 6282 | 200660_at | -0.5834 | 0.0641 | |
| GSE29001 | S100A11 | 6282 | 200660_at | -0.9816 | 0.0012 | |
| GSE38129 | S100A11 | 6282 | 200660_at | -0.0771 | 0.8071 | |
| GSE45670 | S100A11 | 6282 | 200660_at | -0.0136 | 0.9474 | |
| GSE53622 | S100A11 | 6282 | 53314 | -0.1871 | 0.3301 | |
| GSE53624 | S100A11 | 6282 | 53314 | -0.5768 | 0.0000 | |
| GSE63941 | S100A11 | 6282 | 200660_at | 2.0005 | 0.0000 | |
| GSE77861 | S100A11 | 6282 | 200660_at | -0.1322 | 0.4548 | |
| GSE97050 | S100A11 | 6282 | A_23_P126593 | 0.9380 | 0.3038 | |
| SRP007169 | S100A11 | 6282 | RNAseq | -2.1492 | 0.0000 | |
| SRP008496 | S100A11 | 6282 | RNAseq | -1.9779 | 0.0000 | |
| SRP064894 | S100A11 | 6282 | RNAseq | -0.9711 | 0.0015 | |
| SRP133303 | S100A11 | 6282 | RNAseq | -0.7648 | 0.0000 | |
| SRP159526 | S100A11 | 6282 | RNAseq | -0.9856 | 0.0006 | |
| SRP193095 | S100A11 | 6282 | RNAseq | -1.2050 | 0.0000 | |
| SRP219564 | S100A11 | 6282 | RNAseq | -0.7006 | 0.3639 | |
| TCGA | S100A11 | 6282 | RNAseq | 0.3983 | 0.0000 |
Upregulated datasets: 1; Downregulated datasets: 3.
Survival by S100A11 expression:
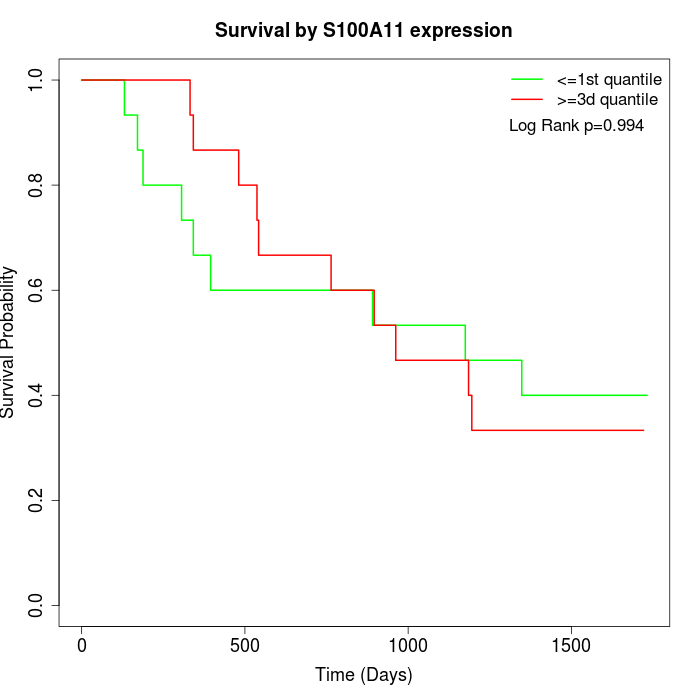 | 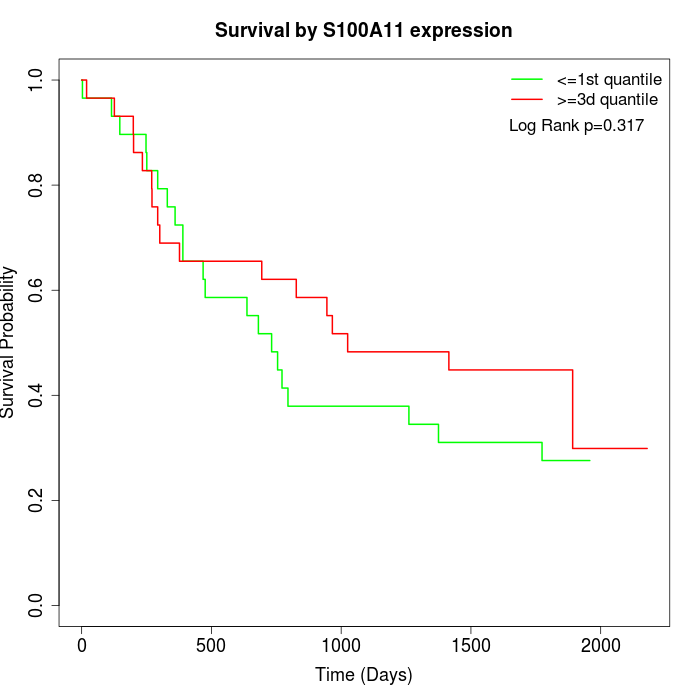 | 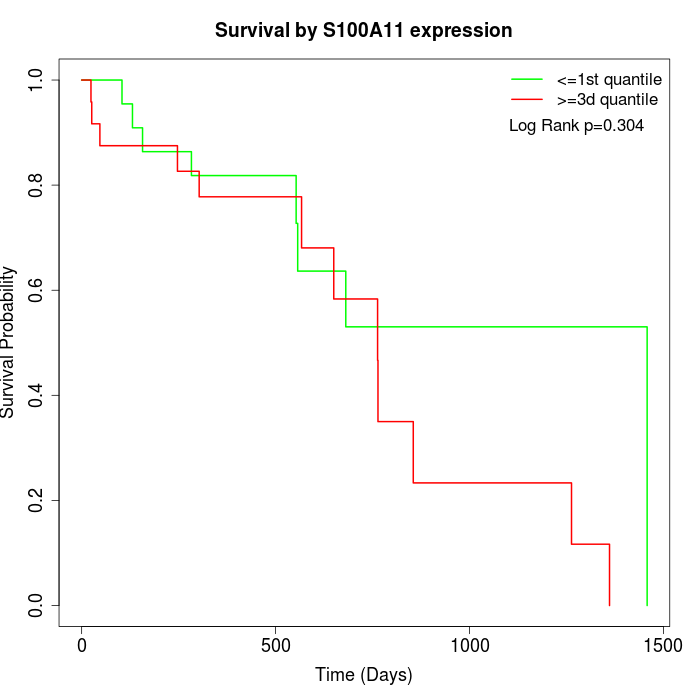 |
| GSE53622 | GSE53624 | TCGA |
Note: Click image to view full size file.
Copy number change of S100A11:
| Dataset | Gene | EntrezID | Gain | Loss | Normal | Detail |
|---|---|---|---|---|---|---|
| GSE15526 | S100A11 | 6282 | 15 | 0 | 15 | |
| GSE20123 | S100A11 | 6282 | 15 | 0 | 15 | |
| GSE43470 | S100A11 | 6282 | 6 | 2 | 35 | |
| GSE46452 | S100A11 | 6282 | 2 | 1 | 56 | |
| GSE47630 | S100A11 | 6282 | 15 | 0 | 25 | |
| GSE54993 | S100A11 | 6282 | 0 | 4 | 66 | |
| GSE54994 | S100A11 | 6282 | 15 | 0 | 38 | |
| GSE60625 | S100A11 | 6282 | 0 | 0 | 11 | |
| GSE74703 | S100A11 | 6282 | 6 | 1 | 29 | |
| GSE74704 | S100A11 | 6282 | 7 | 0 | 13 | |
| TCGA | S100A11 | 6282 | 39 | 2 | 55 |
Total number of gains: 120; Total number of losses: 10; Total Number of normals: 358.
Somatic mutations of S100A11:
Generating mutation plots.
Highly correlated genes for S100A11:
Showing top 20/891 corelated genes with mean PCC>0.5.
| Gene1 | Gene2 | Mean PCC | Num. Datasets | Num. PCC<0 | Num. PCC>0.5 |
|---|---|---|---|---|---|
| S100A11 | SLC7A5 | 0.76319 | 3 | 0 | 3 |
| S100A11 | GNA15 | 0.760786 | 12 | 0 | 12 |
| S100A11 | LAD1 | 0.757133 | 13 | 0 | 12 |
| S100A11 | FXYD3 | 0.737939 | 5 | 0 | 4 |
| S100A11 | MPV17L | 0.733121 | 3 | 0 | 3 |
| S100A11 | MAL2 | 0.726398 | 6 | 0 | 5 |
| S100A11 | CDS1 | 0.722498 | 10 | 0 | 9 |
| S100A11 | DGKA | 0.72058 | 13 | 0 | 12 |
| S100A11 | KRT6C | 0.719611 | 4 | 0 | 3 |
| S100A11 | PPP1R13L | 0.719145 | 12 | 0 | 11 |
| S100A11 | JUP | 0.717 | 13 | 0 | 11 |
| S100A11 | PKP3 | 0.712541 | 13 | 0 | 11 |
| S100A11 | S100A16 | 0.705266 | 8 | 0 | 8 |
| S100A11 | GJB5 | 0.703338 | 12 | 0 | 10 |
| S100A11 | ESRP1 | 0.70113 | 10 | 0 | 9 |
| S100A11 | S100A2 | 0.699986 | 10 | 0 | 8 |
| S100A11 | TECR | 0.699732 | 12 | 0 | 12 |
| S100A11 | GPR87 | 0.699644 | 8 | 0 | 6 |
| S100A11 | SERPINB5 | 0.694136 | 10 | 0 | 8 |
| S100A11 | CAPN1 | 0.693261 | 13 | 0 | 12 |
For details and further investigation, click here