| Full name: myotubularin related protein 11 | Alias Symbol: CRA | ||
| Type: protein-coding gene | Cytoband: 1q21.2 | ||
| Entrez ID: 10903 | HGNC ID: HGNC:24307 | Ensembl Gene: ENSG00000014914 | OMIM ID: |
Expression of MTMR11:
| Dataset | Gene | EntrezID | Probe | Log2FC | Adj.pValue | Expression |
|---|---|---|---|---|---|---|
| GSE17351 | MTMR11 | 10903 | 205076_s_at | -0.0667 | 0.9345 | |
| GSE20347 | MTMR11 | 10903 | 205076_s_at | 0.2572 | 0.0959 | |
| GSE23400 | MTMR11 | 10903 | 205076_s_at | 0.2399 | 0.0169 | |
| GSE26886 | MTMR11 | 10903 | 1556034_s_at | 0.2970 | 0.0339 | |
| GSE29001 | MTMR11 | 10903 | 205076_s_at | 0.6326 | 0.1525 | |
| GSE38129 | MTMR11 | 10903 | 205076_s_at | 0.0131 | 0.9493 | |
| GSE45670 | MTMR11 | 10903 | 205076_s_at | 0.0202 | 0.9616 | |
| GSE53622 | MTMR11 | 10903 | 49892 | 0.4970 | 0.0000 | |
| GSE53624 | MTMR11 | 10903 | 49892 | 0.5475 | 0.0000 | |
| GSE63941 | MTMR11 | 10903 | 1556034_s_at | 0.3135 | 0.4393 | |
| GSE77861 | MTMR11 | 10903 | 1556034_s_at | 0.2998 | 0.2056 | |
| GSE97050 | MTMR11 | 10903 | A_33_P3393927 | 0.0352 | 0.9408 | |
| SRP007169 | MTMR11 | 10903 | RNAseq | -0.2522 | 0.5695 | |
| SRP008496 | MTMR11 | 10903 | RNAseq | 0.1703 | 0.6180 | |
| SRP064894 | MTMR11 | 10903 | RNAseq | 0.3231 | 0.0771 | |
| SRP133303 | MTMR11 | 10903 | RNAseq | -0.0403 | 0.8519 | |
| SRP159526 | MTMR11 | 10903 | RNAseq | -0.1687 | 0.5784 | |
| SRP193095 | MTMR11 | 10903 | RNAseq | -0.1319 | 0.6514 | |
| SRP219564 | MTMR11 | 10903 | RNAseq | 0.1267 | 0.7659 | |
| TCGA | MTMR11 | 10903 | RNAseq | -0.0440 | 0.6497 |
Upregulated datasets: 0; Downregulated datasets: 0.
Survival by MTMR11 expression:
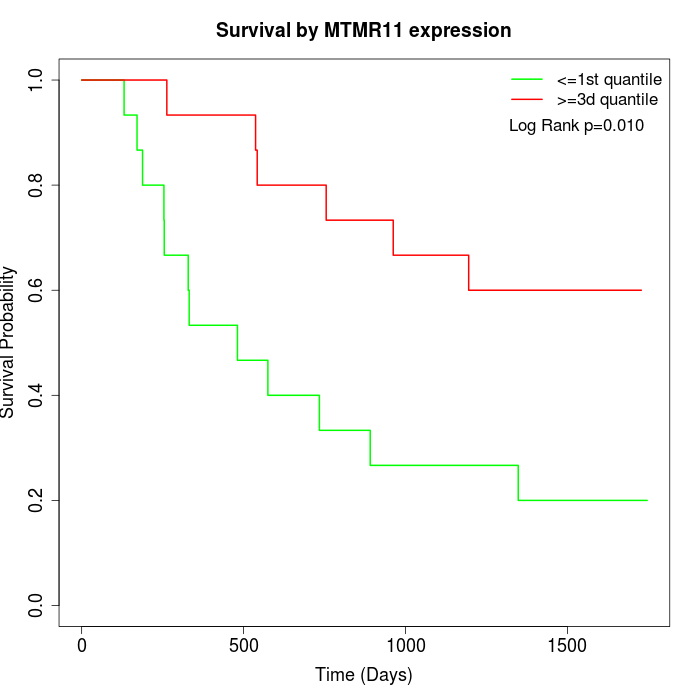 | 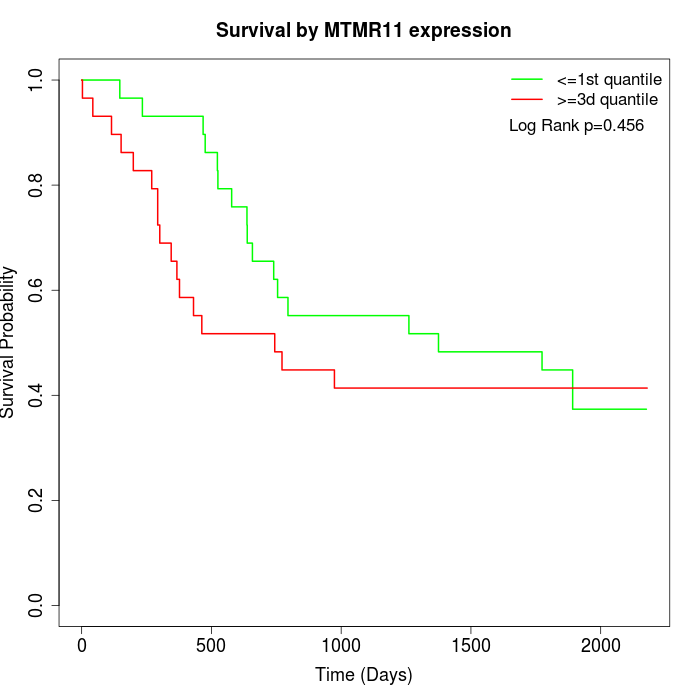 | 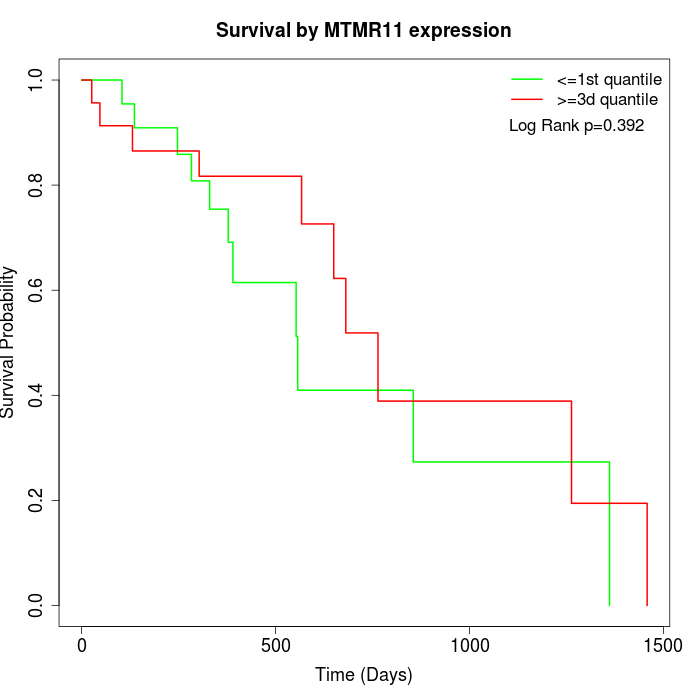 |
| GSE53622 | GSE53624 | TCGA |
Note: Click image to view full size file.
Copy number change of MTMR11:
| Dataset | Gene | EntrezID | Gain | Loss | Normal | Detail |
|---|---|---|---|---|---|---|
| GSE15526 | MTMR11 | 10903 | 15 | 0 | 15 | |
| GSE20123 | MTMR11 | 10903 | 15 | 0 | 15 | |
| GSE43470 | MTMR11 | 10903 | 6 | 1 | 36 | |
| GSE46452 | MTMR11 | 10903 | 2 | 1 | 56 | |
| GSE47630 | MTMR11 | 10903 | 14 | 0 | 26 | |
| GSE54993 | MTMR11 | 10903 | 0 | 3 | 67 | |
| GSE54994 | MTMR11 | 10903 | 15 | 0 | 38 | |
| GSE60625 | MTMR11 | 10903 | 0 | 0 | 11 | |
| GSE74703 | MTMR11 | 10903 | 6 | 1 | 29 | |
| GSE74704 | MTMR11 | 10903 | 7 | 0 | 13 | |
| TCGA | MTMR11 | 10903 | 37 | 4 | 55 |
Total number of gains: 117; Total number of losses: 10; Total Number of normals: 361.
Somatic mutations of MTMR11:
Generating mutation plots.
Highly correlated genes for MTMR11:
Showing top 20/516 corelated genes with mean PCC>0.5.
| Gene1 | Gene2 | Mean PCC | Num. Datasets | Num. PCC<0 | Num. PCC>0.5 |
|---|---|---|---|---|---|
| MTMR11 | C20orf194 | 0.813179 | 3 | 0 | 3 |
| MTMR11 | FILIP1 | 0.776993 | 3 | 0 | 3 |
| MTMR11 | RILP | 0.763706 | 3 | 0 | 3 |
| MTMR11 | INPP5E | 0.751506 | 3 | 0 | 3 |
| MTMR11 | FGF11 | 0.743014 | 3 | 0 | 3 |
| MTMR11 | RAD21 | 0.725483 | 3 | 0 | 3 |
| MTMR11 | DPF2 | 0.724451 | 4 | 0 | 4 |
| MTMR11 | TIMM9 | 0.720981 | 3 | 0 | 3 |
| MTMR11 | ARHGAP4 | 0.719056 | 3 | 0 | 3 |
| MTMR11 | BBS1 | 0.716185 | 3 | 0 | 3 |
| MTMR11 | PITPNC1 | 0.711532 | 3 | 0 | 3 |
| MTMR11 | GMEB2 | 0.710381 | 3 | 0 | 3 |
| MTMR11 | FABP4 | 0.705357 | 3 | 0 | 3 |
| MTMR11 | KCNC4 | 0.703609 | 3 | 0 | 3 |
| MTMR11 | GNG11 | 0.702748 | 3 | 0 | 3 |
| MTMR11 | DGKD | 0.701895 | 3 | 0 | 3 |
| MTMR11 | KCNMA1 | 0.696598 | 3 | 0 | 3 |
| MTMR11 | TNFRSF10D | 0.694813 | 5 | 0 | 4 |
| MTMR11 | LILRB2 | 0.693173 | 3 | 0 | 3 |
| MTMR11 | PFDN1 | 0.692507 | 3 | 0 | 3 |
For details and further investigation, click here