| Full name: glucocorticoid modulatory element binding protein 2 | Alias Symbol: P79PIF|KIAA1269|PIF79 | ||
| Type: protein-coding gene | Cytoband: 20q13.33 | ||
| Entrez ID: 26205 | HGNC ID: HGNC:4371 | Ensembl Gene: ENSG00000101216 | OMIM ID: 607451 |
Expression of GMEB2:
| Dataset | Gene | EntrezID | Probe | Log2FC | Adj.pValue | Expression |
|---|---|---|---|---|---|---|
| GSE17351 | GMEB2 | 26205 | 44146_at | 0.7018 | 0.1185 | |
| GSE20347 | GMEB2 | 26205 | 44146_at | 0.3376 | 0.0008 | |
| GSE23400 | GMEB2 | 26205 | 44146_at | 0.1260 | 0.0003 | |
| GSE26886 | GMEB2 | 26205 | 44146_at | 0.5788 | 0.0059 | |
| GSE29001 | GMEB2 | 26205 | 44146_at | 0.3918 | 0.0480 | |
| GSE38129 | GMEB2 | 26205 | 44146_at | 0.2282 | 0.0086 | |
| GSE45670 | GMEB2 | 26205 | 44146_at | 0.2463 | 0.0319 | |
| GSE53622 | GMEB2 | 26205 | 42403 | 0.4144 | 0.0000 | |
| GSE53624 | GMEB2 | 26205 | 42403 | 0.6991 | 0.0000 | |
| GSE63941 | GMEB2 | 26205 | 44146_at | 0.1838 | 0.5637 | |
| GSE77861 | GMEB2 | 26205 | 44146_at | 0.2473 | 0.0535 | |
| GSE97050 | GMEB2 | 26205 | A_23_P337033 | -0.0368 | 0.9029 | |
| SRP007169 | GMEB2 | 26205 | RNAseq | -0.1176 | 0.7684 | |
| SRP008496 | GMEB2 | 26205 | RNAseq | -0.2687 | 0.4491 | |
| SRP064894 | GMEB2 | 26205 | RNAseq | 0.2953 | 0.0591 | |
| SRP133303 | GMEB2 | 26205 | RNAseq | 0.1032 | 0.4945 | |
| SRP159526 | GMEB2 | 26205 | RNAseq | 0.2148 | 0.4085 | |
| SRP193095 | GMEB2 | 26205 | RNAseq | 0.4261 | 0.0000 | |
| SRP219564 | GMEB2 | 26205 | RNAseq | 0.4499 | 0.2055 | |
| TCGA | GMEB2 | 26205 | RNAseq | 0.1017 | 0.0526 |
Upregulated datasets: 0; Downregulated datasets: 0.
Survival by GMEB2 expression:
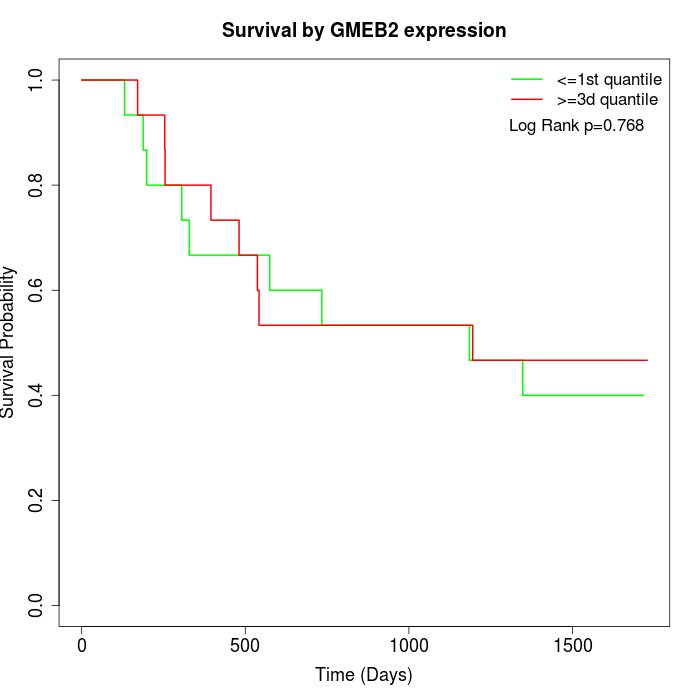 | 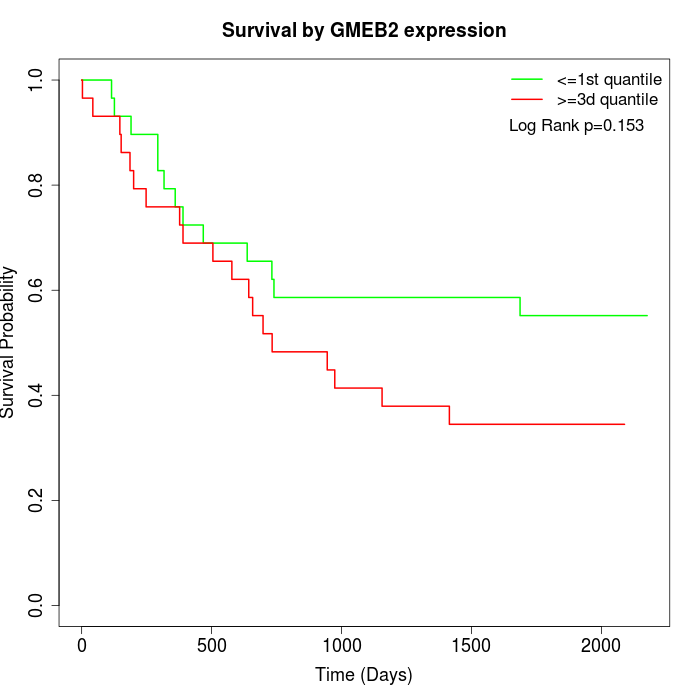 | 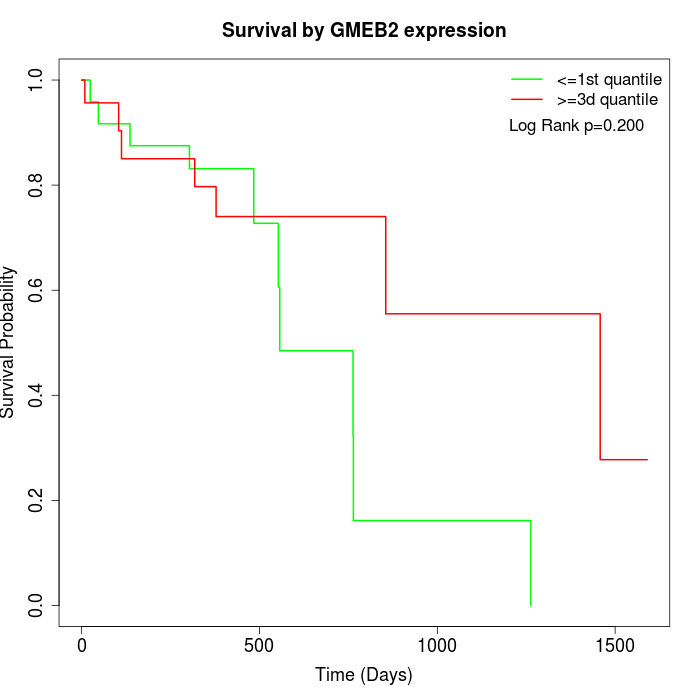 |
| GSE53622 | GSE53624 | TCGA |
Note: Click image to view full size file.
Copy number change of GMEB2:
| Dataset | Gene | EntrezID | Gain | Loss | Normal | Detail |
|---|---|---|---|---|---|---|
| GSE15526 | GMEB2 | 26205 | 14 | 2 | 14 | |
| GSE20123 | GMEB2 | 26205 | 14 | 2 | 14 | |
| GSE43470 | GMEB2 | 26205 | 11 | 1 | 31 | |
| GSE46452 | GMEB2 | 26205 | 35 | 0 | 24 | |
| GSE47630 | GMEB2 | 26205 | 25 | 1 | 14 | |
| GSE54993 | GMEB2 | 26205 | 0 | 17 | 53 | |
| GSE54994 | GMEB2 | 26205 | 29 | 0 | 24 | |
| GSE60625 | GMEB2 | 26205 | 0 | 0 | 11 | |
| GSE74703 | GMEB2 | 26205 | 10 | 0 | 26 | |
| GSE74704 | GMEB2 | 26205 | 11 | 0 | 9 | |
| TCGA | GMEB2 | 26205 | 44 | 4 | 48 |
Total number of gains: 193; Total number of losses: 27; Total Number of normals: 268.
Somatic mutations of GMEB2:
Generating mutation plots.
Highly correlated genes for GMEB2:
Showing top 20/1221 corelated genes with mean PCC>0.5.
| Gene1 | Gene2 | Mean PCC | Num. Datasets | Num. PCC<0 | Num. PCC>0.5 |
|---|---|---|---|---|---|
| GMEB2 | DGCR2 | 0.813909 | 4 | 0 | 4 |
| GMEB2 | TMEM63B | 0.805912 | 3 | 0 | 3 |
| GMEB2 | ERGIC1 | 0.801808 | 3 | 0 | 3 |
| GMEB2 | MACF1 | 0.786059 | 3 | 0 | 3 |
| GMEB2 | SMAD1 | 0.77779 | 3 | 0 | 3 |
| GMEB2 | PSMB6 | 0.770646 | 3 | 0 | 3 |
| GMEB2 | INPP5B | 0.769552 | 3 | 0 | 3 |
| GMEB2 | CHD3 | 0.764218 | 4 | 0 | 4 |
| GMEB2 | DROSHA | 0.761254 | 4 | 0 | 3 |
| GMEB2 | DAPK3 | 0.755019 | 3 | 0 | 3 |
| GMEB2 | SNAPC2 | 0.751996 | 3 | 0 | 3 |
| GMEB2 | SLC25A38 | 0.750664 | 3 | 0 | 3 |
| GMEB2 | CISD2 | 0.740382 | 3 | 0 | 3 |
| GMEB2 | ATXN1L | 0.739067 | 3 | 0 | 3 |
| GMEB2 | FIP1L1 | 0.738444 | 3 | 0 | 3 |
| GMEB2 | DOT1L | 0.738433 | 3 | 0 | 3 |
| GMEB2 | SFR1 | 0.738248 | 3 | 0 | 3 |
| GMEB2 | DGCR8 | 0.736064 | 3 | 0 | 3 |
| GMEB2 | NAF1 | 0.731235 | 4 | 0 | 4 |
| GMEB2 | DDX59 | 0.730533 | 3 | 0 | 3 |
For details and further investigation, click here