| Full name: MYB proto-oncogene like 1 | Alias Symbol: AMYB|A-myb | ||
| Type: protein-coding gene | Cytoband: 8q13.1 | ||
| Entrez ID: 4603 | HGNC ID: HGNC:7547 | Ensembl Gene: ENSG00000185697 | OMIM ID: 159405 |
Screen Evidence:
| |||
Expression of MYBL1:
| Dataset | Gene | EntrezID | Probe | Log2FC | Adj.pValue | Expression |
|---|---|---|---|---|---|---|
| GSE17351 | MYBL1 | 4603 | 231268_at | 0.0044 | 0.9895 | |
| GSE20347 | MYBL1 | 4603 | 213906_at | 1.1876 | 0.0014 | |
| GSE23400 | MYBL1 | 4603 | 213906_at | 0.3308 | 0.0000 | |
| GSE26886 | MYBL1 | 4603 | 213906_at | 0.0582 | 0.9095 | |
| GSE29001 | MYBL1 | 4603 | 213906_at | 1.1012 | 0.0114 | |
| GSE38129 | MYBL1 | 4603 | 213906_at | 0.8969 | 0.0041 | |
| GSE45670 | MYBL1 | 4603 | 231268_at | -0.1194 | 0.2770 | |
| GSE53622 | MYBL1 | 4603 | 65253 | 0.5744 | 0.0000 | |
| GSE53624 | MYBL1 | 4603 | 65253 | 0.8591 | 0.0000 | |
| GSE63941 | MYBL1 | 4603 | 213906_at | -0.7232 | 0.6202 | |
| GSE77861 | MYBL1 | 4603 | 231268_at | -0.1133 | 0.6297 | |
| GSE97050 | MYBL1 | 4603 | A_33_P3346891 | 0.9132 | 0.1666 | |
| SRP007169 | MYBL1 | 4603 | RNAseq | 1.0900 | 0.1346 | |
| SRP064894 | MYBL1 | 4603 | RNAseq | 1.3710 | 0.0000 | |
| SRP133303 | MYBL1 | 4603 | RNAseq | 0.9132 | 0.0001 | |
| SRP159526 | MYBL1 | 4603 | RNAseq | 0.0756 | 0.9062 | |
| SRP193095 | MYBL1 | 4603 | RNAseq | 0.5452 | 0.0009 | |
| SRP219564 | MYBL1 | 4603 | RNAseq | 1.0262 | 0.0707 | |
| TCGA | MYBL1 | 4603 | RNAseq | 0.3687 | 0.0100 |
Upregulated datasets: 3; Downregulated datasets: 0.
Survival by MYBL1 expression:
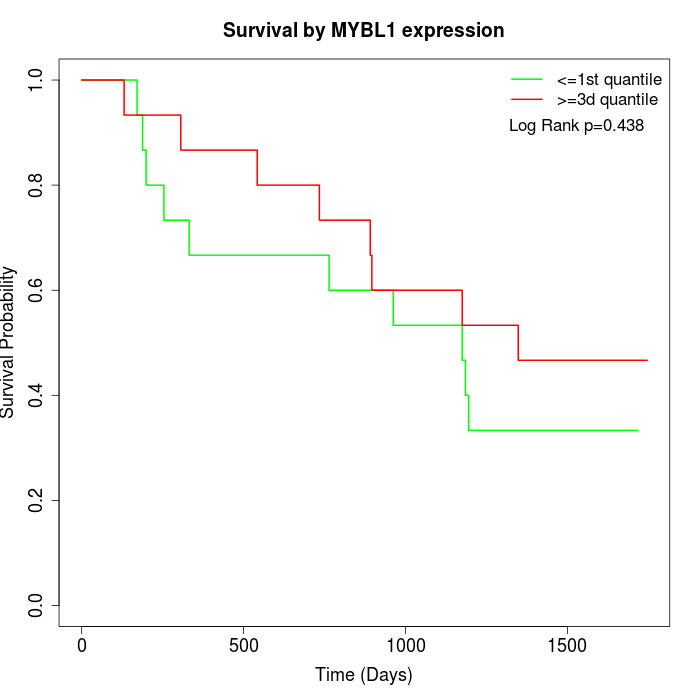 | 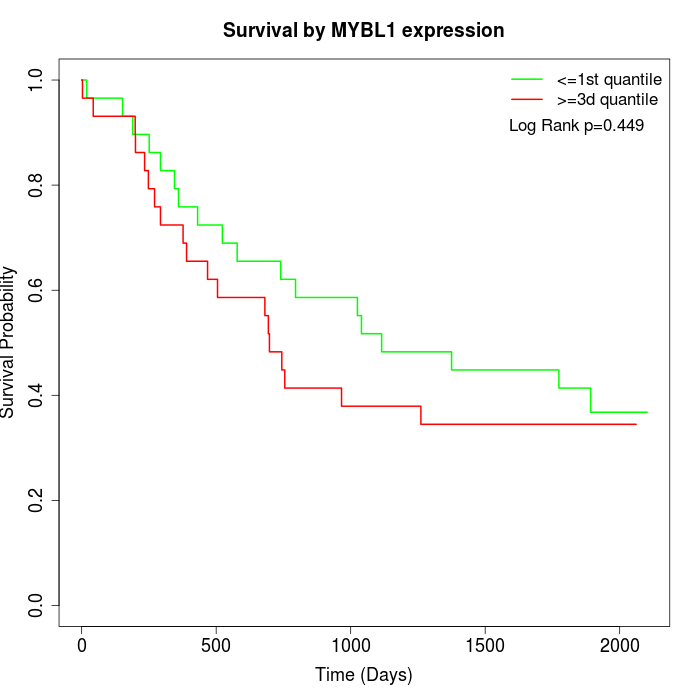 | 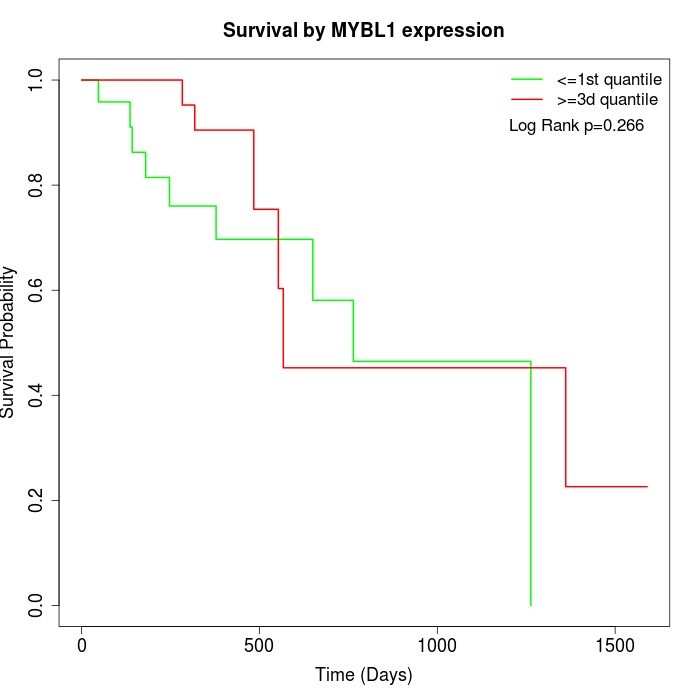 |
| GSE53622 | GSE53624 | TCGA |
Note: Click image to view full size file.
Copy number change of MYBL1:
| Dataset | Gene | EntrezID | Gain | Loss | Normal | Detail |
|---|---|---|---|---|---|---|
| GSE15526 | MYBL1 | 4603 | 14 | 1 | 15 | |
| GSE20123 | MYBL1 | 4603 | 15 | 1 | 14 | |
| GSE43470 | MYBL1 | 4603 | 15 | 3 | 25 | |
| GSE46452 | MYBL1 | 4603 | 20 | 2 | 37 | |
| GSE47630 | MYBL1 | 4603 | 23 | 1 | 16 | |
| GSE54993 | MYBL1 | 4603 | 1 | 18 | 51 | |
| GSE54994 | MYBL1 | 4603 | 30 | 0 | 23 | |
| GSE60625 | MYBL1 | 4603 | 0 | 4 | 7 | |
| GSE74703 | MYBL1 | 4603 | 13 | 2 | 21 | |
| GSE74704 | MYBL1 | 4603 | 10 | 0 | 10 | |
| TCGA | MYBL1 | 4603 | 49 | 4 | 43 |
Total number of gains: 190; Total number of losses: 36; Total Number of normals: 262.
Somatic mutations of MYBL1:
Generating mutation plots.
Highly correlated genes for MYBL1:
Showing top 20/357 corelated genes with mean PCC>0.5.
| Gene1 | Gene2 | Mean PCC | Num. Datasets | Num. PCC<0 | Num. PCC>0.5 |
|---|---|---|---|---|---|
| MYBL1 | RBP2 | 0.791288 | 3 | 0 | 3 |
| MYBL1 | ACY1 | 0.726305 | 3 | 0 | 3 |
| MYBL1 | ZNF579 | 0.699748 | 3 | 0 | 3 |
| MYBL1 | IKBIP | 0.690019 | 3 | 0 | 3 |
| MYBL1 | C2CD4B | 0.683914 | 4 | 0 | 4 |
| MYBL1 | FMN2 | 0.683521 | 3 | 0 | 3 |
| MYBL1 | WDR54 | 0.682507 | 3 | 0 | 3 |
| MYBL1 | FCGR3A | 0.677817 | 3 | 0 | 3 |
| MYBL1 | PCBP3 | 0.677285 | 3 | 0 | 3 |
| MYBL1 | IL2RA | 0.672788 | 3 | 0 | 3 |
| MYBL1 | RNF24 | 0.669111 | 3 | 0 | 3 |
| MYBL1 | TRIT1 | 0.659744 | 3 | 0 | 3 |
| MYBL1 | SNAP47 | 0.65922 | 3 | 0 | 3 |
| MYBL1 | LINGO1 | 0.658501 | 3 | 0 | 3 |
| MYBL1 | SLC43A2 | 0.657151 | 4 | 0 | 4 |
| MYBL1 | LRRC8C | 0.656307 | 3 | 0 | 3 |
| MYBL1 | LIPF | 0.655994 | 3 | 0 | 3 |
| MYBL1 | ALG6 | 0.655153 | 4 | 0 | 3 |
| MYBL1 | USP1 | 0.65413 | 8 | 0 | 6 |
| MYBL1 | SERPINF2 | 0.652147 | 3 | 0 | 3 |
For details and further investigation, click here