| Full name: myosin light chain 2 | Alias Symbol: CMH10 | ||
| Type: protein-coding gene | Cytoband: 12q24.11 | ||
| Entrez ID: 4633 | HGNC ID: HGNC:7583 | Ensembl Gene: ENSG00000111245 | OMIM ID: 160781 |
| Related drugs: OMECAMTIV MECARBIL... [more] | |||
MYL2 involved pathways:
Expression of MYL2:
| Dataset | Gene | EntrezID | Probe | Log2FC | Adj.pValue | Expression |
|---|---|---|---|---|---|---|
| GSE17351 | MYL2 | 4633 | 209742_s_at | -0.0213 | 0.9455 | |
| GSE20347 | MYL2 | 4633 | 209742_s_at | -0.0666 | 0.3640 | |
| GSE23400 | MYL2 | 4633 | 209742_s_at | -0.1183 | 0.2408 | |
| GSE26886 | MYL2 | 4633 | 209742_s_at | -0.0365 | 0.7209 | |
| GSE29001 | MYL2 | 4633 | 209742_s_at | -0.0860 | 0.4386 | |
| GSE38129 | MYL2 | 4633 | 209742_s_at | -0.0055 | 0.9638 | |
| GSE45670 | MYL2 | 4633 | 209742_s_at | -0.0286 | 0.7782 | |
| GSE53622 | MYL2 | 4633 | 11387 | -1.3433 | 0.0000 | |
| GSE53624 | MYL2 | 4633 | 11387 | -1.0910 | 0.0000 | |
| GSE63941 | MYL2 | 4633 | 209742_s_at | 0.0976 | 0.5798 | |
| GSE77861 | MYL2 | 4633 | 209742_s_at | -0.0898 | 0.4503 | |
| GSE97050 | MYL2 | 4633 | A_23_P162547 | -2.4150 | 0.0866 | |
| TCGA | MYL2 | 4633 | RNAseq | 0.9257 | 0.5828 |
Upregulated datasets: 0; Downregulated datasets: 2.
Survival by MYL2 expression:
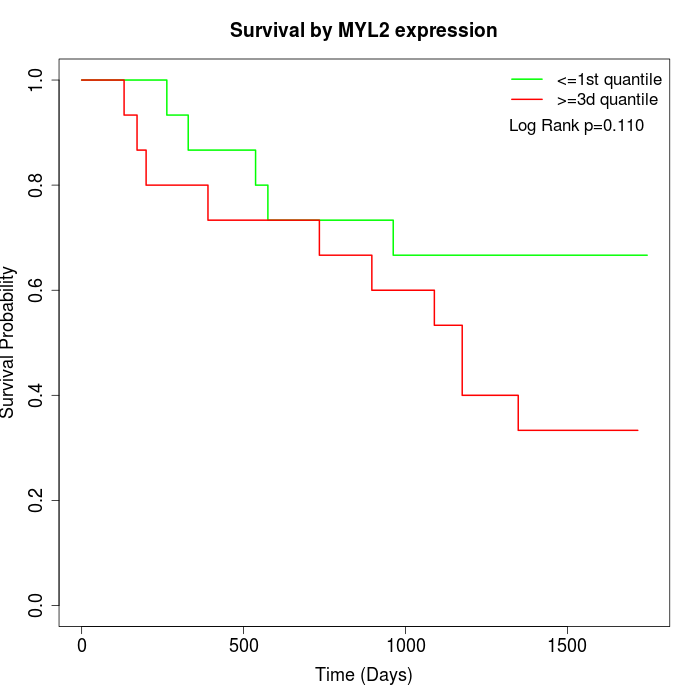 | 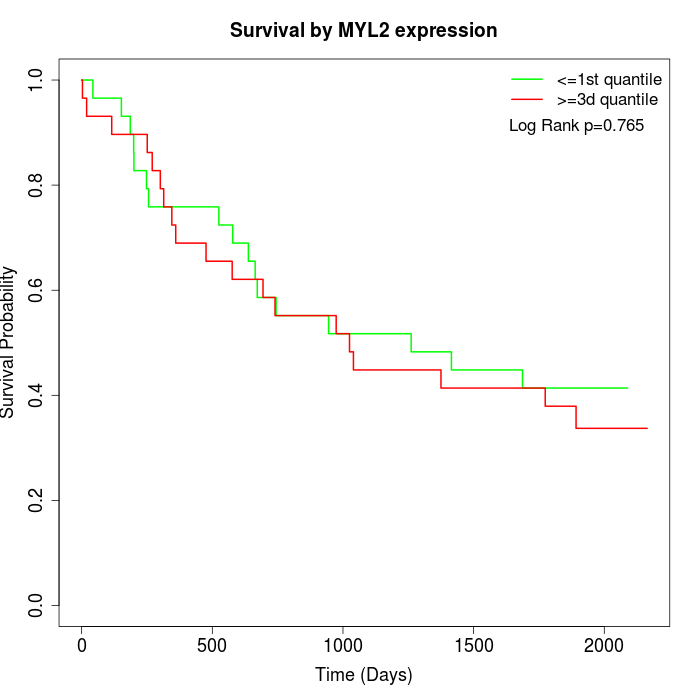 | 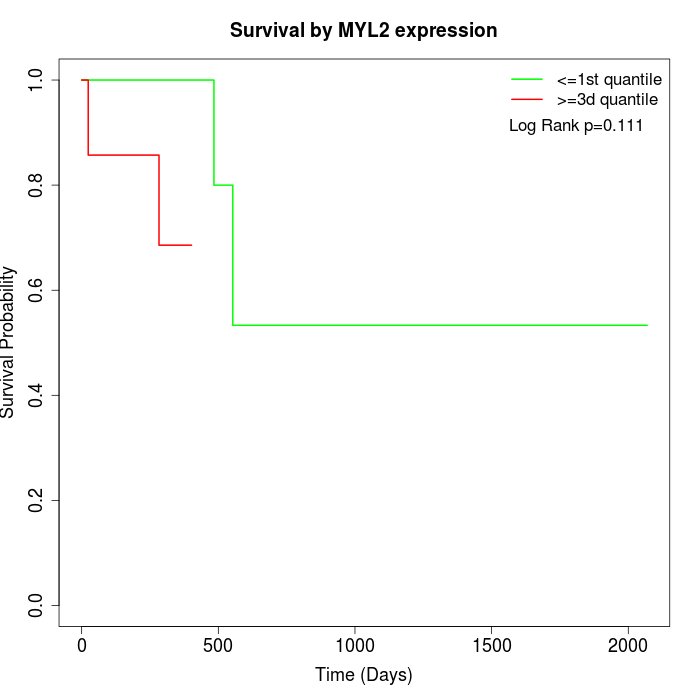 |
| GSE53622 | GSE53624 | TCGA |
Note: Click image to view full size file.
Copy number change of MYL2:
| Dataset | Gene | EntrezID | Gain | Loss | Normal | Detail |
|---|---|---|---|---|---|---|
| GSE15526 | MYL2 | 4633 | 5 | 3 | 22 | |
| GSE20123 | MYL2 | 4633 | 5 | 3 | 22 | |
| GSE43470 | MYL2 | 4633 | 2 | 1 | 40 | |
| GSE46452 | MYL2 | 4633 | 9 | 1 | 49 | |
| GSE47630 | MYL2 | 4633 | 9 | 3 | 28 | |
| GSE54993 | MYL2 | 4633 | 0 | 5 | 65 | |
| GSE54994 | MYL2 | 4633 | 5 | 2 | 46 | |
| GSE60625 | MYL2 | 4633 | 0 | 0 | 11 | |
| GSE74703 | MYL2 | 4633 | 2 | 0 | 34 | |
| GSE74704 | MYL2 | 4633 | 2 | 2 | 16 | |
| TCGA | MYL2 | 4633 | 22 | 11 | 63 |
Total number of gains: 61; Total number of losses: 31; Total Number of normals: 396.
Somatic mutations of MYL2:
Generating mutation plots.
Highly correlated genes for MYL2:
Showing top 20/341 corelated genes with mean PCC>0.5.
| Gene1 | Gene2 | Mean PCC | Num. Datasets | Num. PCC<0 | Num. PCC>0.5 |
|---|---|---|---|---|---|
| MYL2 | VMAC | 0.752805 | 3 | 0 | 3 |
| MYL2 | MYL1 | 0.721431 | 4 | 0 | 4 |
| MYL2 | DSTN | 0.713504 | 3 | 0 | 3 |
| MYL2 | MB | 0.695498 | 3 | 0 | 3 |
| MYL2 | SLMAP | 0.688732 | 3 | 0 | 3 |
| MYL2 | KRT36 | 0.674733 | 3 | 0 | 3 |
| MYL2 | C9orf50 | 0.670845 | 3 | 0 | 3 |
| MYL2 | ACTBL2 | 0.667091 | 3 | 0 | 3 |
| MYL2 | PDE1B | 0.665256 | 5 | 0 | 5 |
| MYL2 | DACT2 | 0.658714 | 3 | 0 | 3 |
| MYL2 | RBPMS | 0.651719 | 4 | 0 | 3 |
| MYL2 | S100B | 0.651716 | 3 | 0 | 3 |
| MYL2 | SORBS1 | 0.649894 | 4 | 0 | 3 |
| MYL2 | BNC2 | 0.64955 | 4 | 0 | 3 |
| MYL2 | SH2D3C | 0.649478 | 3 | 0 | 3 |
| MYL2 | LINC01215 | 0.64571 | 3 | 0 | 3 |
| MYL2 | TCAP | 0.645184 | 5 | 0 | 4 |
| MYL2 | BTC | 0.643242 | 3 | 0 | 3 |
| MYL2 | THRB | 0.642868 | 3 | 0 | 3 |
| MYL2 | ENHO | 0.642764 | 3 | 0 | 3 |
For details and further investigation, click here