| Full name: myosin light chain 9 | Alias Symbol: MYRL2|MLC2|LC20|MRLC1 | ||
| Type: protein-coding gene | Cytoband: 20q11.23 | ||
| Entrez ID: 10398 | HGNC ID: HGNC:15754 | Ensembl Gene: ENSG00000101335 | OMIM ID: 609905 |
MYL9 involved pathways:
Expression of MYL9:
| Dataset | Gene | EntrezID | Probe | Log2FC | Adj.pValue | Expression |
|---|---|---|---|---|---|---|
| GSE17351 | MYL9 | 10398 | 201058_s_at | -1.6098 | 0.3636 | |
| GSE20347 | MYL9 | 10398 | 201058_s_at | -0.3975 | 0.4918 | |
| GSE23400 | MYL9 | 10398 | 201058_s_at | -1.2767 | 0.0000 | |
| GSE26886 | MYL9 | 10398 | 244149_at | 0.1362 | 0.2674 | |
| GSE29001 | MYL9 | 10398 | 201058_s_at | -0.4264 | 0.3656 | |
| GSE38129 | MYL9 | 10398 | 201058_s_at | -1.0292 | 0.1156 | |
| GSE45670 | MYL9 | 10398 | 201058_s_at | -3.2446 | 0.0000 | |
| GSE53622 | MYL9 | 10398 | 37930 | -1.4783 | 0.0000 | |
| GSE53624 | MYL9 | 10398 | 37930 | -1.2801 | 0.0000 | |
| GSE63941 | MYL9 | 10398 | 244149_at | -0.1931 | 0.4716 | |
| GSE77861 | MYL9 | 10398 | 244149_at | -0.1534 | 0.1054 | |
| GSE97050 | MYL9 | 10398 | A_23_P210425 | -1.3393 | 0.1148 | |
| SRP007169 | MYL9 | 10398 | RNAseq | 3.2674 | 0.0000 | |
| SRP008496 | MYL9 | 10398 | RNAseq | 4.2477 | 0.0000 | |
| SRP064894 | MYL9 | 10398 | RNAseq | -1.3314 | 0.0009 | |
| SRP133303 | MYL9 | 10398 | RNAseq | -1.8142 | 0.0000 | |
| SRP159526 | MYL9 | 10398 | RNAseq | -1.6061 | 0.0014 | |
| SRP193095 | MYL9 | 10398 | RNAseq | 0.6477 | 0.1423 | |
| SRP219564 | MYL9 | 10398 | RNAseq | -1.6887 | 0.1580 | |
| TCGA | MYL9 | 10398 | RNAseq | -0.4520 | 0.0008 |
Upregulated datasets: 2; Downregulated datasets: 7.
Survival by MYL9 expression:
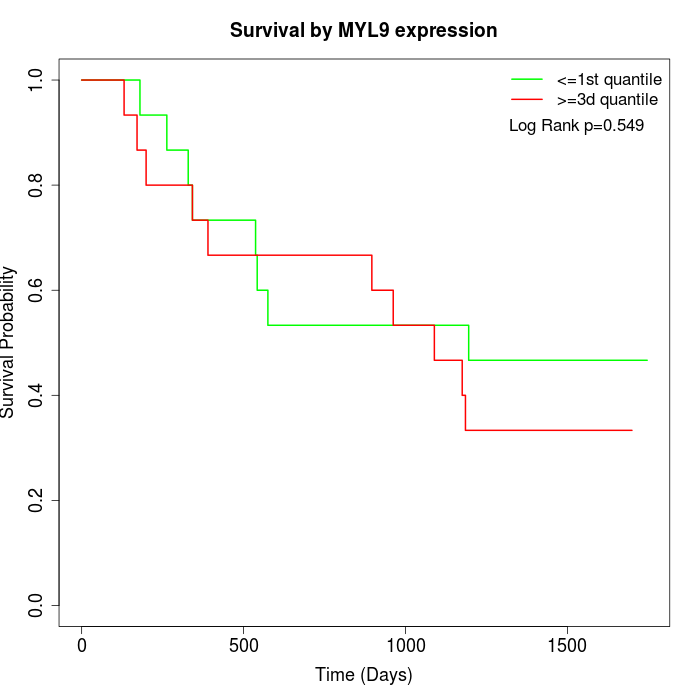 | 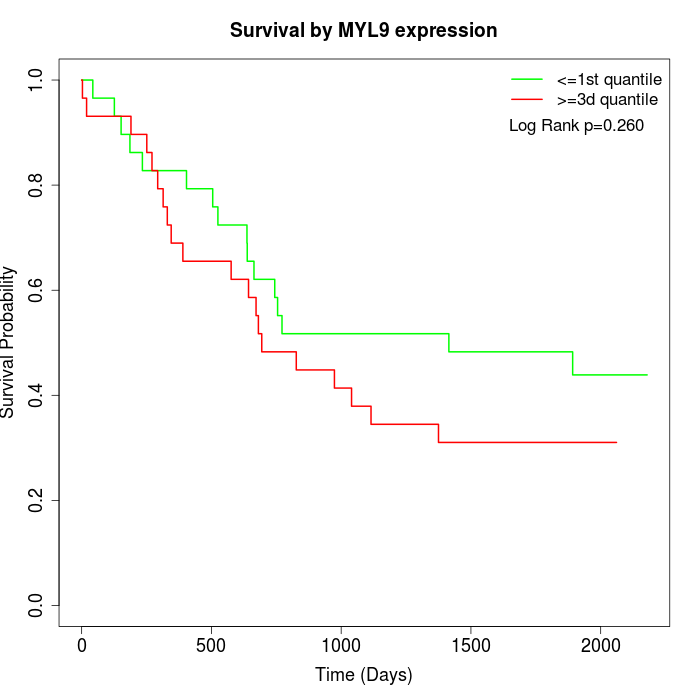 | 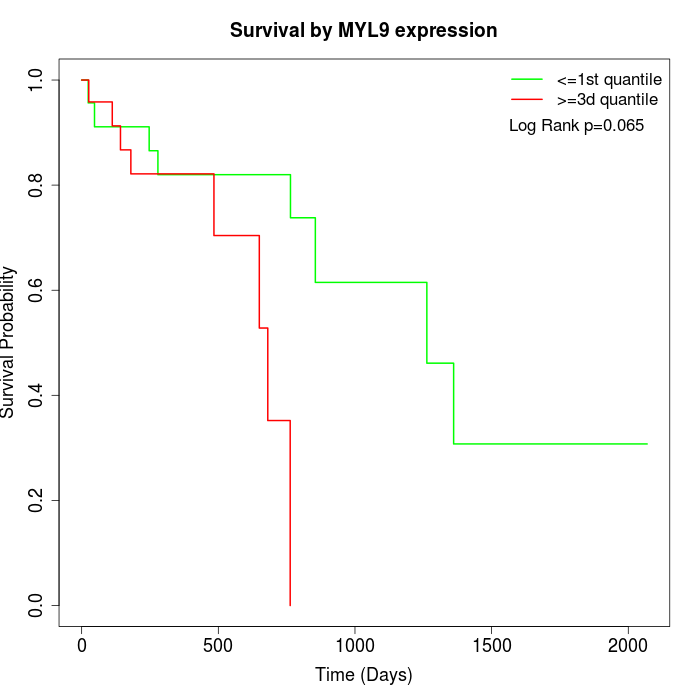 |
| GSE53622 | GSE53624 | TCGA |
Note: Click image to view full size file.
Copy number change of MYL9:
| Dataset | Gene | EntrezID | Gain | Loss | Normal | Detail |
|---|---|---|---|---|---|---|
| GSE15526 | MYL9 | 10398 | 14 | 2 | 14 | |
| GSE20123 | MYL9 | 10398 | 14 | 2 | 14 | |
| GSE43470 | MYL9 | 10398 | 12 | 0 | 31 | |
| GSE46452 | MYL9 | 10398 | 29 | 0 | 30 | |
| GSE47630 | MYL9 | 10398 | 24 | 0 | 16 | |
| GSE54993 | MYL9 | 10398 | 0 | 17 | 53 | |
| GSE54994 | MYL9 | 10398 | 24 | 0 | 29 | |
| GSE60625 | MYL9 | 10398 | 0 | 0 | 11 | |
| GSE74703 | MYL9 | 10398 | 11 | 0 | 25 | |
| GSE74704 | MYL9 | 10398 | 10 | 1 | 9 | |
| TCGA | MYL9 | 10398 | 49 | 3 | 44 |
Total number of gains: 187; Total number of losses: 25; Total Number of normals: 276.
Somatic mutations of MYL9:
Generating mutation plots.
Highly correlated genes for MYL9:
Showing top 20/1035 corelated genes with mean PCC>0.5.
| Gene1 | Gene2 | Mean PCC | Num. Datasets | Num. PCC<0 | Num. PCC>0.5 |
|---|---|---|---|---|---|
| MYL9 | MYL5 | 0.872915 | 4 | 0 | 4 |
| MYL9 | ACTBL2 | 0.845606 | 3 | 0 | 3 |
| MYL9 | TAGLN | 0.83933 | 13 | 0 | 12 |
| MYL9 | DES | 0.828713 | 11 | 0 | 11 |
| MYL9 | AOC3 | 0.825109 | 11 | 0 | 10 |
| MYL9 | LMOD1 | 0.8068 | 12 | 0 | 11 |
| MYL9 | XKR4 | 0.806188 | 5 | 0 | 5 |
| MYL9 | CYP21A2 | 0.805397 | 3 | 0 | 3 |
| MYL9 | ATP1A2 | 0.801862 | 10 | 0 | 9 |
| MYL9 | FLNC | 0.797596 | 12 | 0 | 12 |
| MYL9 | PRUNE2 | 0.794595 | 11 | 0 | 10 |
| MYL9 | CFL2 | 0.791559 | 5 | 0 | 5 |
| MYL9 | NCAM1 | 0.789679 | 8 | 0 | 8 |
| MYL9 | MYOCD | 0.787914 | 6 | 0 | 5 |
| MYL9 | ADAMTS9-AS2 | 0.784408 | 4 | 0 | 4 |
| MYL9 | ITGA7 | 0.784162 | 9 | 0 | 9 |
| MYL9 | CHRDL1 | 0.783503 | 9 | 0 | 8 |
| MYL9 | KANK2 | 0.776834 | 12 | 0 | 11 |
| MYL9 | CLEC3B | 0.776559 | 3 | 0 | 3 |
| MYL9 | NEGR1 | 0.776045 | 6 | 0 | 5 |
For details and further investigation, click here