| Full name: nicotinamide phosphoribosyltransferase | Alias Symbol: PBEF | ||
| Type: protein-coding gene | Cytoband: 7q22.3 | ||
| Entrez ID: 10135 | HGNC ID: HGNC:30092 | Ensembl Gene: ENSG00000105835 | OMIM ID: 608764 |
| Related drugs: TEGLARINAD CHLORIDE... [more] | |||
Screen Evidence:
| |||
Expression of NAMPT:
| Dataset | Gene | EntrezID | Probe | Log2FC | Adj.pValue | Expression |
|---|---|---|---|---|---|---|
| GSE17351 | NAMPT | 10135 | 217739_s_at | -0.6464 | 0.4285 | |
| GSE20347 | NAMPT | 10135 | 217739_s_at | -1.0453 | 0.0005 | |
| GSE23400 | NAMPT | 10135 | 217739_s_at | -0.8220 | 0.0000 | |
| GSE26886 | NAMPT | 10135 | 217739_s_at | -1.6533 | 0.0000 | |
| GSE29001 | NAMPT | 10135 | 217739_s_at | -1.1601 | 0.0029 | |
| GSE38129 | NAMPT | 10135 | 217739_s_at | -0.5232 | 0.1071 | |
| GSE45670 | NAMPT | 10135 | 217739_s_at | -0.4313 | 0.1664 | |
| GSE53622 | NAMPT | 10135 | 5527 | -0.5025 | 0.0004 | |
| GSE53624 | NAMPT | 10135 | 5527 | -0.9290 | 0.0000 | |
| GSE63941 | NAMPT | 10135 | 217739_s_at | 0.3264 | 0.5941 | |
| GSE77861 | NAMPT | 10135 | 217739_s_at | -0.5565 | 0.2974 | |
| GSE97050 | NAMPT | 10135 | A_33_P3364864 | 0.2037 | 0.7443 | |
| SRP007169 | NAMPT | 10135 | RNAseq | -2.6632 | 0.0000 | |
| SRP008496 | NAMPT | 10135 | RNAseq | -2.2075 | 0.0000 | |
| SRP064894 | NAMPT | 10135 | RNAseq | -1.0766 | 0.0032 | |
| SRP133303 | NAMPT | 10135 | RNAseq | -0.6070 | 0.0070 | |
| SRP159526 | NAMPT | 10135 | RNAseq | -0.4885 | 0.5341 | |
| SRP193095 | NAMPT | 10135 | RNAseq | -0.2643 | 0.4213 | |
| SRP219564 | NAMPT | 10135 | RNAseq | -0.5595 | 0.3021 | |
| TCGA | NAMPT | 10135 | RNAseq | 0.0889 | 0.3330 |
Upregulated datasets: 0; Downregulated datasets: 6.
Survival by NAMPT expression:
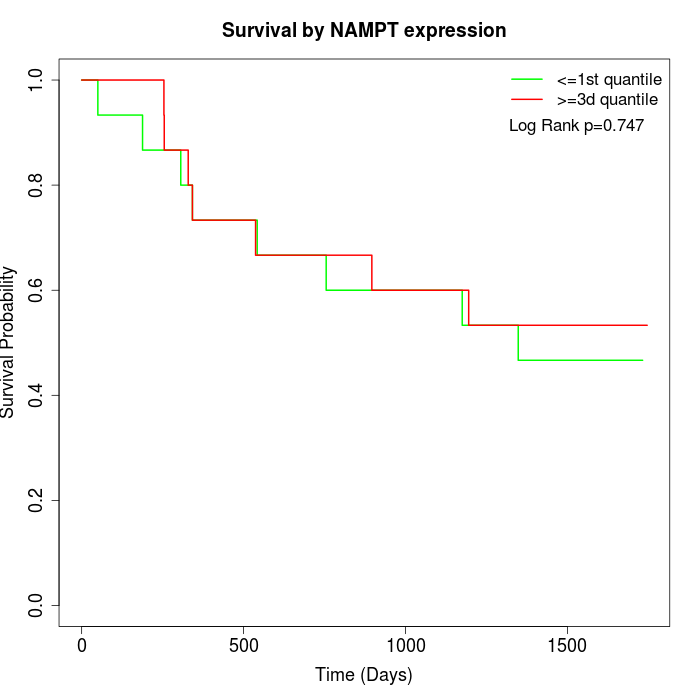 | 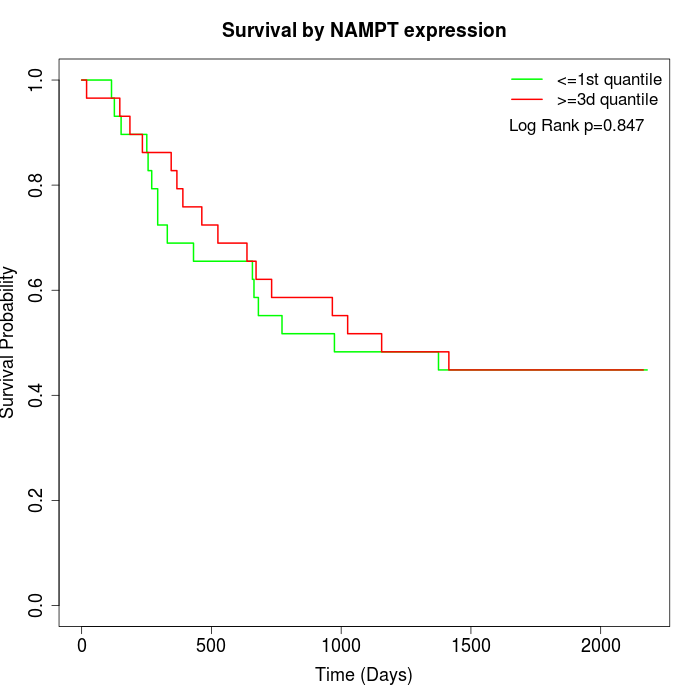 | 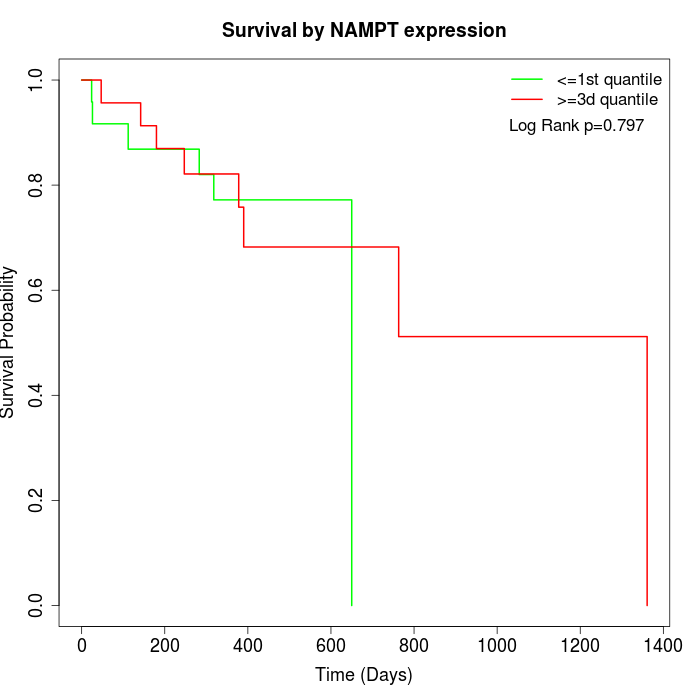 |
| GSE53622 | GSE53624 | TCGA |
Note: Click image to view full size file.
Copy number change of NAMPT:
| Dataset | Gene | EntrezID | Gain | Loss | Normal | Detail |
|---|---|---|---|---|---|---|
| GSE15526 | NAMPT | 10135 | 12 | 0 | 18 | |
| GSE20123 | NAMPT | 10135 | 12 | 0 | 18 | |
| GSE43470 | NAMPT | 10135 | 7 | 1 | 35 | |
| GSE46452 | NAMPT | 10135 | 10 | 1 | 48 | |
| GSE47630 | NAMPT | 10135 | 7 | 3 | 30 | |
| GSE54993 | NAMPT | 10135 | 2 | 9 | 59 | |
| GSE54994 | NAMPT | 10135 | 15 | 3 | 35 | |
| GSE60625 | NAMPT | 10135 | 0 | 0 | 11 | |
| GSE74703 | NAMPT | 10135 | 7 | 1 | 28 | |
| GSE74704 | NAMPT | 10135 | 8 | 0 | 12 | |
| TCGA | NAMPT | 10135 | 52 | 9 | 35 |
Total number of gains: 132; Total number of losses: 27; Total Number of normals: 329.
Somatic mutations of NAMPT:
Generating mutation plots.
Highly correlated genes for NAMPT:
Showing top 20/708 corelated genes with mean PCC>0.5.
| Gene1 | Gene2 | Mean PCC | Num. Datasets | Num. PCC<0 | Num. PCC>0.5 |
|---|---|---|---|---|---|
| NAMPT | GJB2 | 0.834314 | 3 | 0 | 3 |
| NAMPT | SH3PXD2A-AS1 | 0.784988 | 3 | 0 | 3 |
| NAMPT | PLS3 | 0.704306 | 6 | 0 | 6 |
| NAMPT | IL22RA1 | 0.696875 | 7 | 0 | 6 |
| NAMPT | PTGR1 | 0.687402 | 7 | 0 | 7 |
| NAMPT | UBE2D2 | 0.683117 | 3 | 0 | 3 |
| NAMPT | DSG1 | 0.681724 | 5 | 0 | 5 |
| NAMPT | TALDO1 | 0.678256 | 8 | 0 | 7 |
| NAMPT | GJB6 | 0.674428 | 5 | 0 | 3 |
| NAMPT | PGD | 0.671937 | 11 | 0 | 11 |
| NAMPT | CYP4F3 | 0.661432 | 11 | 0 | 11 |
| NAMPT | HPSE | 0.657807 | 11 | 0 | 9 |
| NAMPT | VTI1A | 0.65668 | 3 | 0 | 3 |
| NAMPT | METRNL | 0.655615 | 7 | 0 | 6 |
| NAMPT | MALL | 0.652826 | 10 | 0 | 9 |
| NAMPT | LYNX1 | 0.650106 | 6 | 0 | 5 |
| NAMPT | VSIG10L | 0.64806 | 6 | 0 | 5 |
| NAMPT | SLC25A51 | 0.646504 | 4 | 0 | 3 |
| NAMPT | GBP6 | 0.640952 | 5 | 0 | 4 |
| NAMPT | TMPRSS11E | 0.638948 | 11 | 0 | 10 |
For details and further investigation, click here