| Full name: heparanase | Alias Symbol: HPA|HSE1|HPSE1 | ||
| Type: protein-coding gene | Cytoband: 4q21.23 | ||
| Entrez ID: 10855 | HGNC ID: HGNC:5164 | Ensembl Gene: ENSG00000173083 | OMIM ID: 604724 |
| Related drugs: HEPARIN, MUPARFOSTAT (CHEMBL1615835), THROMBIN... [more] | |||
HPSE involved pathways:
| KEGG pathway | Description | View |
|---|---|---|
| hsa05205 | Proteoglycans in cancer |
Expression of HPSE:
| Dataset | Gene | EntrezID | Probe | Log2FC | Adj.pValue | Expression |
|---|---|---|---|---|---|---|
| GSE17351 | HPSE | 10855 | 219403_s_at | -0.9962 | 0.4829 | |
| GSE20347 | HPSE | 10855 | 219403_s_at | -2.2591 | 0.0000 | |
| GSE23400 | HPSE | 10855 | 219403_s_at | -1.2930 | 0.0000 | |
| GSE26886 | HPSE | 10855 | 219403_s_at | -2.4476 | 0.0000 | |
| GSE29001 | HPSE | 10855 | 219403_s_at | -2.2673 | 0.0001 | |
| GSE38129 | HPSE | 10855 | 219403_s_at | -1.2964 | 0.0073 | |
| GSE45670 | HPSE | 10855 | 219403_s_at | -0.3619 | 0.4142 | |
| GSE53622 | HPSE | 10855 | 26219 | -0.6371 | 0.0044 | |
| GSE53624 | HPSE | 10855 | 65098 | -1.4526 | 0.0000 | |
| GSE63941 | HPSE | 10855 | 219403_s_at | 1.9881 | 0.0469 | |
| GSE77861 | HPSE | 10855 | 219403_s_at | -1.3925 | 0.0233 | |
| GSE97050 | HPSE | 10855 | A_23_P256107 | 0.3642 | 0.6509 | |
| SRP007169 | HPSE | 10855 | RNAseq | -1.9596 | 0.0000 | |
| SRP008496 | HPSE | 10855 | RNAseq | -1.9560 | 0.0000 | |
| SRP064894 | HPSE | 10855 | RNAseq | -1.3007 | 0.0000 | |
| SRP133303 | HPSE | 10855 | RNAseq | -0.1820 | 0.3214 | |
| SRP159526 | HPSE | 10855 | RNAseq | -1.1759 | 0.0041 | |
| SRP193095 | HPSE | 10855 | RNAseq | -0.7033 | 0.0005 | |
| SRP219564 | HPSE | 10855 | RNAseq | -1.9006 | 0.0233 | |
| TCGA | HPSE | 10855 | RNAseq | 0.6189 | 0.0005 |
Upregulated datasets: 1; Downregulated datasets: 12.
Survival by HPSE expression:
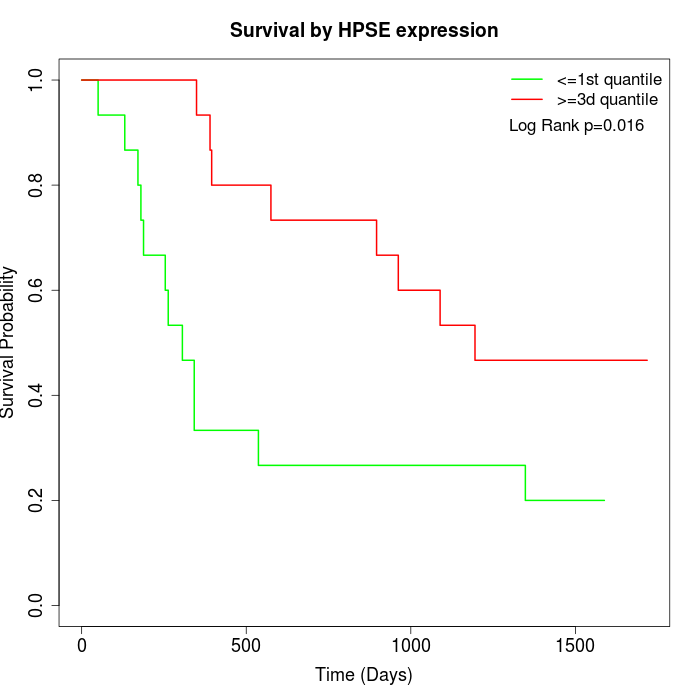 | 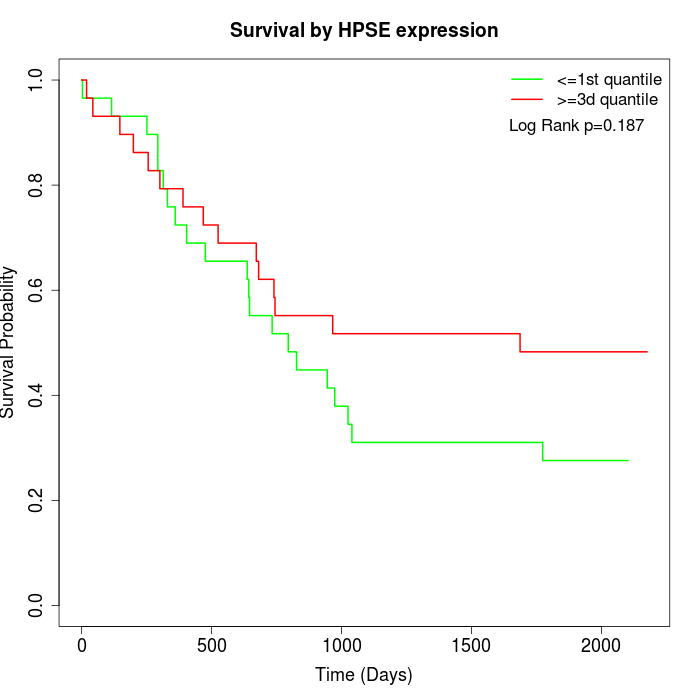 | 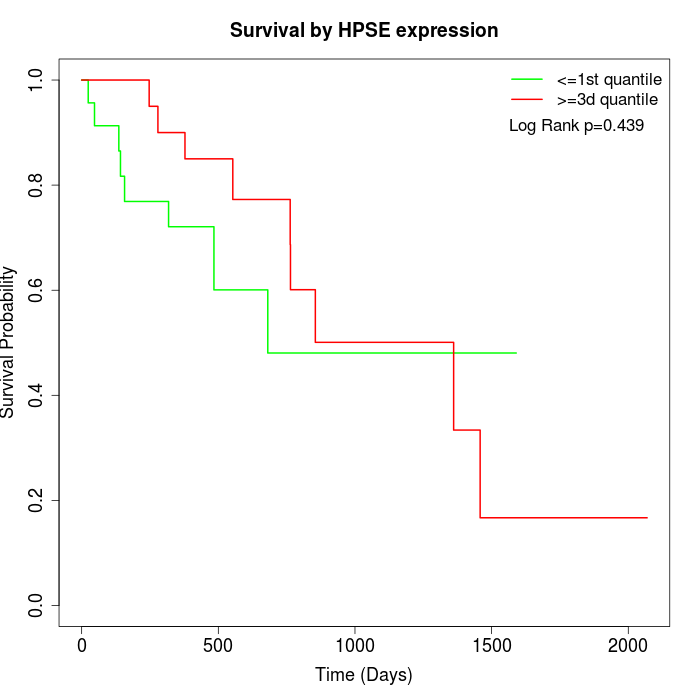 |
| GSE53622 | GSE53624 | TCGA |
Note: Click image to view full size file.
Copy number change of HPSE:
| Dataset | Gene | EntrezID | Gain | Loss | Normal | Detail |
|---|---|---|---|---|---|---|
| GSE15526 | HPSE | 10855 | 2 | 11 | 17 | |
| GSE20123 | HPSE | 10855 | 2 | 11 | 17 | |
| GSE43470 | HPSE | 10855 | 0 | 13 | 30 | |
| GSE46452 | HPSE | 10855 | 1 | 36 | 22 | |
| GSE47630 | HPSE | 10855 | 0 | 20 | 20 | |
| GSE54993 | HPSE | 10855 | 8 | 0 | 62 | |
| GSE54994 | HPSE | 10855 | 1 | 9 | 43 | |
| GSE60625 | HPSE | 10855 | 0 | 0 | 11 | |
| GSE74703 | HPSE | 10855 | 0 | 11 | 25 | |
| GSE74704 | HPSE | 10855 | 1 | 6 | 13 | |
| TCGA | HPSE | 10855 | 11 | 34 | 51 |
Total number of gains: 26; Total number of losses: 151; Total Number of normals: 311.
Somatic mutations of HPSE:
Generating mutation plots.
Highly correlated genes for HPSE:
Showing top 20/1335 corelated genes with mean PCC>0.5.
| Gene1 | Gene2 | Mean PCC | Num. Datasets | Num. PCC<0 | Num. PCC>0.5 |
|---|---|---|---|---|---|
| HPSE | TOM1 | 0.807955 | 11 | 0 | 11 |
| HPSE | PRSS2 | 0.790469 | 8 | 0 | 8 |
| HPSE | CXCR2 | 0.78594 | 9 | 0 | 9 |
| HPSE | CLIC3 | 0.784833 | 9 | 0 | 8 |
| HPSE | GDPD3 | 0.784183 | 10 | 0 | 10 |
| HPSE | SH3GL1 | 0.782381 | 11 | 0 | 11 |
| HPSE | MFSD5 | 0.776267 | 11 | 0 | 11 |
| HPSE | CRCT1 | 0.773712 | 10 | 0 | 10 |
| HPSE | CES2 | 0.770858 | 8 | 0 | 8 |
| HPSE | TMPRSS11E | 0.770708 | 11 | 0 | 10 |
| HPSE | PRSS27 | 0.770047 | 6 | 0 | 6 |
| HPSE | ARNTL2 | 0.766802 | 11 | 0 | 11 |
| HPSE | CYSRT1 | 0.765386 | 6 | 0 | 6 |
| HPSE | EVPL | 0.763177 | 11 | 0 | 11 |
| HPSE | PLIN3 | 0.761847 | 11 | 0 | 11 |
| HPSE | LYNX1 | 0.760892 | 6 | 0 | 6 |
| HPSE | PRDM1 | 0.759721 | 11 | 0 | 11 |
| HPSE | NUAK2 | 0.758136 | 3 | 0 | 3 |
| HPSE | PRSS3 | 0.755872 | 11 | 0 | 10 |
| HPSE | CEACAM7 | 0.755763 | 10 | 0 | 10 |
For details and further investigation, click here