| Full name: N-terminal EF-hand calcium binding protein 2 | Alias Symbol: | ||
| Type: protein-coding gene | Cytoband: 16q23.3 | ||
| Entrez ID: 54550 | HGNC ID: HGNC:23746 | Ensembl Gene: ENSG00000103154 | OMIM ID: 618130 |
Expression of NECAB2:
| Dataset | Gene | EntrezID | Probe | Log2FC | Adj.pValue | Expression |
|---|---|---|---|---|---|---|
| GSE17351 | NECAB2 | 54550 | 215005_at | -0.0517 | 0.8473 | |
| GSE20347 | NECAB2 | 54550 | 215005_at | 0.0877 | 0.3092 | |
| GSE23400 | NECAB2 | 54550 | 215005_at | -0.0417 | 0.4226 | |
| GSE26886 | NECAB2 | 54550 | 215005_at | 0.1203 | 0.2913 | |
| GSE29001 | NECAB2 | 54550 | 215005_at | -0.1440 | 0.4288 | |
| GSE38129 | NECAB2 | 54550 | 215005_at | 0.1625 | 0.2621 | |
| GSE45670 | NECAB2 | 54550 | 215005_at | 0.1617 | 0.1802 | |
| GSE53622 | NECAB2 | 54550 | 103046 | 1.3889 | 0.0000 | |
| GSE53624 | NECAB2 | 54550 | 103046 | 2.0980 | 0.0000 | |
| GSE63941 | NECAB2 | 54550 | 215005_at | 0.1341 | 0.6275 | |
| GSE77861 | NECAB2 | 54550 | 215005_at | 0.0357 | 0.6501 | |
| SRP159526 | NECAB2 | 54550 | RNAseq | 5.5985 | 0.0000 | |
| TCGA | NECAB2 | 54550 | RNAseq | 1.2294 | 0.0825 |
Upregulated datasets: 3; Downregulated datasets: 0.
Survival by NECAB2 expression:
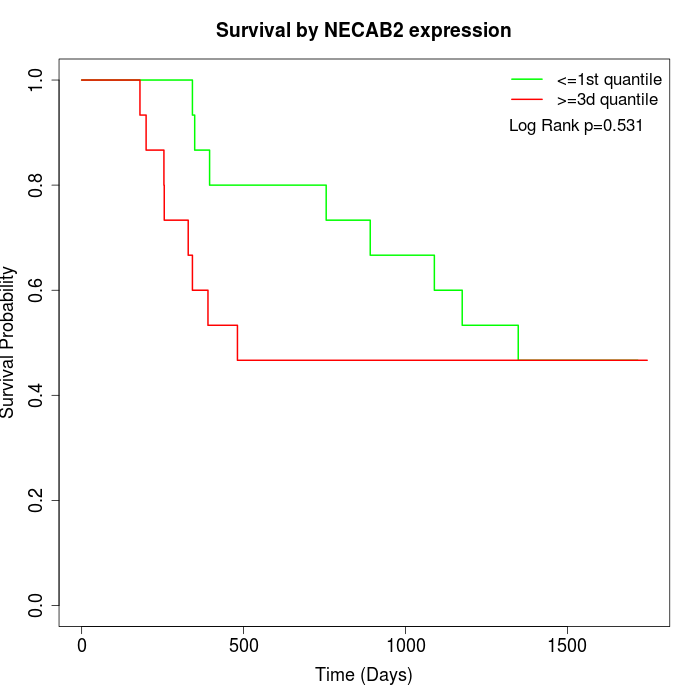 | 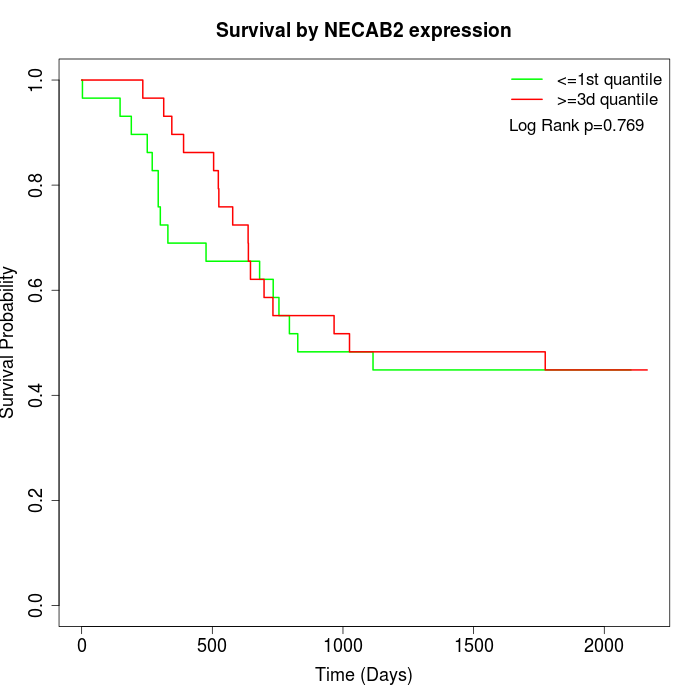 | 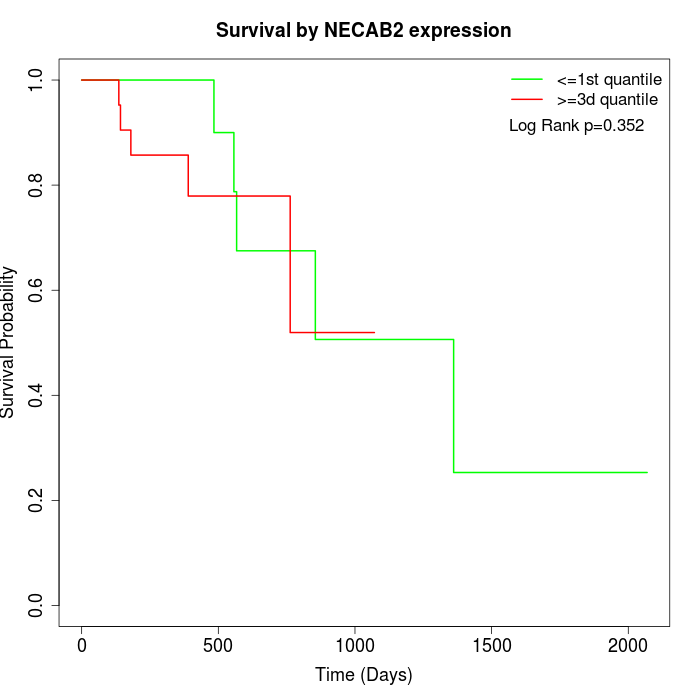 |
| GSE53622 | GSE53624 | TCGA |
Note: Click image to view full size file.
Copy number change of NECAB2:
| Dataset | Gene | EntrezID | Gain | Loss | Normal | Detail |
|---|---|---|---|---|---|---|
| GSE15526 | NECAB2 | 54550 | 5 | 4 | 21 | |
| GSE20123 | NECAB2 | 54550 | 4 | 4 | 22 | |
| GSE43470 | NECAB2 | 54550 | 2 | 10 | 31 | |
| GSE46452 | NECAB2 | 54550 | 37 | 2 | 20 | |
| GSE47630 | NECAB2 | 54550 | 11 | 9 | 20 | |
| GSE54993 | NECAB2 | 54550 | 3 | 4 | 63 | |
| GSE54994 | NECAB2 | 54550 | 8 | 10 | 35 | |
| GSE60625 | NECAB2 | 54550 | 4 | 0 | 7 | |
| GSE74703 | NECAB2 | 54550 | 2 | 7 | 27 | |
| GSE74704 | NECAB2 | 54550 | 3 | 2 | 15 | |
| TCGA | NECAB2 | 54550 | 25 | 18 | 53 |
Total number of gains: 104; Total number of losses: 70; Total Number of normals: 314.
Somatic mutations of NECAB2:
Generating mutation plots.
Highly correlated genes for NECAB2:
Showing top 20/53 corelated genes with mean PCC>0.5.
| Gene1 | Gene2 | Mean PCC | Num. Datasets | Num. PCC<0 | Num. PCC>0.5 |
|---|---|---|---|---|---|
| NECAB2 | MUC3B | 0.745928 | 3 | 0 | 3 |
| NECAB2 | CACNA1S | 0.672876 | 3 | 0 | 3 |
| NECAB2 | FGB | 0.657116 | 3 | 0 | 3 |
| NECAB2 | CCL25 | 0.655275 | 4 | 0 | 3 |
| NECAB2 | FSCN3 | 0.637409 | 3 | 0 | 3 |
| NECAB2 | CNNM1 | 0.631964 | 3 | 0 | 3 |
| NECAB2 | KIR2DL5A | 0.62929 | 4 | 0 | 3 |
| NECAB2 | TSPAN32 | 0.62928 | 3 | 0 | 3 |
| NECAB2 | SMOX | 0.609808 | 4 | 0 | 3 |
| NECAB2 | KCNJ3 | 0.605944 | 4 | 0 | 3 |
| NECAB2 | IL13 | 0.602809 | 4 | 0 | 3 |
| NECAB2 | COLEC10 | 0.593969 | 5 | 0 | 3 |
| NECAB2 | HECW1 | 0.592569 | 5 | 0 | 3 |
| NECAB2 | CCDC177 | 0.590842 | 8 | 0 | 7 |
| NECAB2 | SCN10A | 0.588604 | 4 | 0 | 3 |
| NECAB2 | IL11 | 0.582534 | 4 | 0 | 3 |
| NECAB2 | TCN2 | 0.579828 | 3 | 0 | 3 |
| NECAB2 | SOX15 | 0.575671 | 4 | 0 | 3 |
| NECAB2 | IFNA7 | 0.574993 | 4 | 0 | 3 |
| NECAB2 | DLX6 | 0.573168 | 6 | 0 | 5 |
For details and further investigation, click here