| Full name: neuronal tyrosine phosphorylated phosphoinositide-3-kinase adaptor 1 | Alias Symbol: FLJ37538 | ||
| Type: protein-coding gene | Cytoband: 7q22.1 | ||
| Entrez ID: 222950 | HGNC ID: HGNC:22009 | Ensembl Gene: ENSG00000166924 | OMIM ID: 615477 |
Expression of NYAP1:
| Dataset | Gene | EntrezID | Probe | Log2FC | Adj.pValue | Expression |
|---|---|---|---|---|---|---|
| GSE17351 | NYAP1 | 222950 | 1553288_a_at | -0.1612 | 0.3736 | |
| GSE26886 | NYAP1 | 222950 | 1553288_a_at | -0.2811 | 0.0110 | |
| GSE45670 | NYAP1 | 222950 | 1553288_a_at | -0.2973 | 0.0079 | |
| GSE53622 | NYAP1 | 222950 | 88109 | -0.2705 | 0.0000 | |
| GSE53624 | NYAP1 | 222950 | 88109 | -0.1916 | 0.0130 | |
| GSE63941 | NYAP1 | 222950 | 1553288_a_at | 0.0613 | 0.6579 | |
| GSE77861 | NYAP1 | 222950 | 1553288_a_at | -0.1207 | 0.2656 | |
| SRP064894 | NYAP1 | 222950 | RNAseq | -1.2938 | 0.0006 | |
| SRP133303 | NYAP1 | 222950 | RNAseq | -1.0173 | 0.0008 | |
| SRP159526 | NYAP1 | 222950 | RNAseq | 0.0743 | 0.9025 | |
| SRP219564 | NYAP1 | 222950 | RNAseq | -0.9431 | 0.0520 |
Upregulated datasets: 0; Downregulated datasets: 2.
Survival by NYAP1 expression:
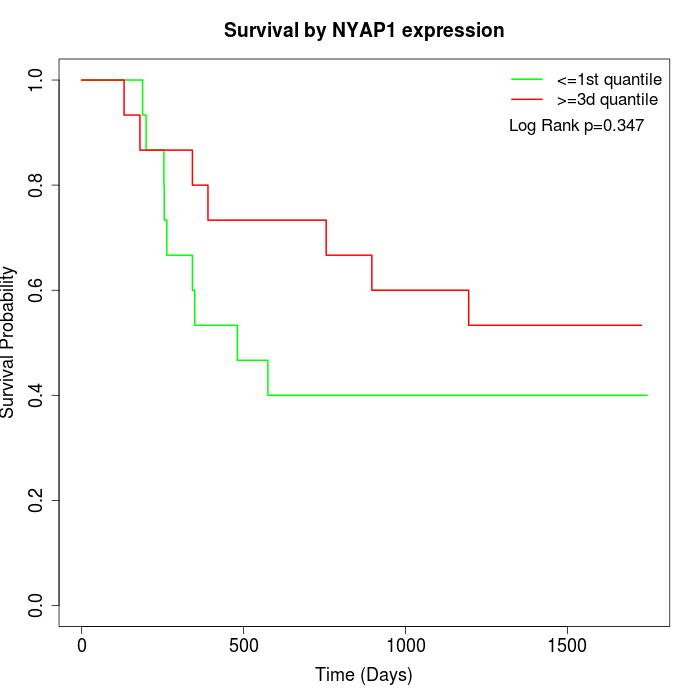 | 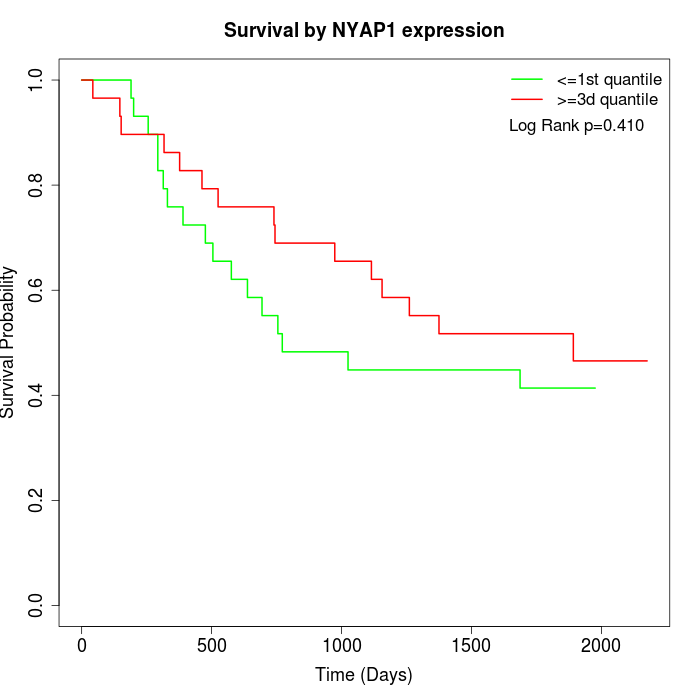 |
| GSE53622 | GSE53624 |
Note: Click image to view full size file.
Copy number change of NYAP1:
| Dataset | Gene | EntrezID | Gain | Loss | Normal | Detail |
|---|---|---|---|---|---|---|
| GSE15526 | NYAP1 | 222950 | 13 | 0 | 17 | |
| GSE20123 | NYAP1 | 222950 | 13 | 0 | 17 | |
| GSE43470 | NYAP1 | 222950 | 7 | 2 | 34 | |
| GSE46452 | NYAP1 | 222950 | 11 | 1 | 47 | |
| GSE47630 | NYAP1 | 222950 | 7 | 3 | 30 | |
| GSE54993 | NYAP1 | 222950 | 1 | 9 | 60 | |
| GSE54994 | NYAP1 | 222950 | 16 | 3 | 34 | |
| GSE60625 | NYAP1 | 222950 | 0 | 0 | 11 | |
| GSE74703 | NYAP1 | 222950 | 7 | 1 | 28 | |
| GSE74704 | NYAP1 | 222950 | 9 | 0 | 11 | |
| TCGA | NYAP1 | 222950 | 52 | 6 | 38 |
Total number of gains: 136; Total number of losses: 25; Total Number of normals: 327.
Somatic mutations of NYAP1:
Generating mutation plots.
Highly correlated genes for NYAP1:
Showing top 20/186 corelated genes with mean PCC>0.5.
| Gene1 | Gene2 | Mean PCC | Num. Datasets | Num. PCC<0 | Num. PCC>0.5 |
|---|---|---|---|---|---|
| NYAP1 | USP53 | 0.708054 | 3 | 0 | 3 |
| NYAP1 | MAGIX | 0.683779 | 4 | 0 | 4 |
| NYAP1 | SRP14 | 0.679301 | 3 | 0 | 3 |
| NYAP1 | COX8A | 0.6757 | 3 | 0 | 3 |
| NYAP1 | RECQL5 | 0.669525 | 3 | 0 | 3 |
| NYAP1 | CSK | 0.659407 | 3 | 0 | 3 |
| NYAP1 | BCKDHA | 0.649796 | 3 | 0 | 3 |
| NYAP1 | SMPD2 | 0.638936 | 3 | 0 | 3 |
| NYAP1 | COBL | 0.638515 | 4 | 0 | 3 |
| NYAP1 | CXCL17 | 0.630685 | 3 | 0 | 3 |
| NYAP1 | CYP4F12 | 0.622393 | 4 | 0 | 4 |
| NYAP1 | FAM95B1 | 0.620471 | 4 | 0 | 3 |
| NYAP1 | TPRG1 | 0.619867 | 3 | 0 | 3 |
| NYAP1 | SIM2 | 0.61597 | 4 | 0 | 3 |
| NYAP1 | TIFA | 0.61545 | 3 | 0 | 3 |
| NYAP1 | GSTK1 | 0.614212 | 3 | 0 | 3 |
| NYAP1 | LINC00092 | 0.613854 | 4 | 0 | 3 |
| NYAP1 | BEX4 | 0.61341 | 4 | 0 | 3 |
| NYAP1 | GMDS | 0.612791 | 3 | 0 | 3 |
| NYAP1 | TMEM114 | 0.61195 | 4 | 0 | 3 |
For details and further investigation, click here