| Full name: tumor protein p63 regulated 1 | Alias Symbol: FLJ41238|FLJ43694 | ||
| Type: protein-coding gene | Cytoband: 3q28 | ||
| Entrez ID: 285386 | HGNC ID: HGNC:24759 | Ensembl Gene: ENSG00000188001 | OMIM ID: |
Expression of TPRG1:
| Dataset | Gene | EntrezID | Probe | Log2FC | Adj.pValue | Expression |
|---|---|---|---|---|---|---|
| GSE17351 | TPRG1 | 285386 | 229764_at | -2.0011 | 0.3219 | |
| GSE26886 | TPRG1 | 285386 | 229764_at | -3.7036 | 0.0000 | |
| GSE45670 | TPRG1 | 285386 | 229764_at | -1.1153 | 0.0675 | |
| GSE53622 | TPRG1 | 285386 | 38243 | -1.4364 | 0.0000 | |
| GSE53624 | TPRG1 | 285386 | 110828 | -2.9281 | 0.0000 | |
| GSE63941 | TPRG1 | 285386 | 229764_at | 3.7851 | 0.0615 | |
| GSE77861 | TPRG1 | 285386 | 229764_at | -2.5253 | 0.0022 | |
| GSE97050 | TPRG1 | 285386 | A_33_P3372044 | -0.6332 | 0.2179 | |
| SRP008496 | TPRG1 | 285386 | RNAseq | -2.7284 | 0.0022 | |
| SRP064894 | TPRG1 | 285386 | RNAseq | -3.3472 | 0.0000 | |
| SRP133303 | TPRG1 | 285386 | RNAseq | -2.5968 | 0.0000 | |
| SRP159526 | TPRG1 | 285386 | RNAseq | -2.0793 | 0.0014 | |
| SRP219564 | TPRG1 | 285386 | RNAseq | -3.8333 | 0.0002 | |
| TCGA | TPRG1 | 285386 | RNAseq | 0.9115 | 0.0002 |
Upregulated datasets: 0; Downregulated datasets: 9.
Survival by TPRG1 expression:
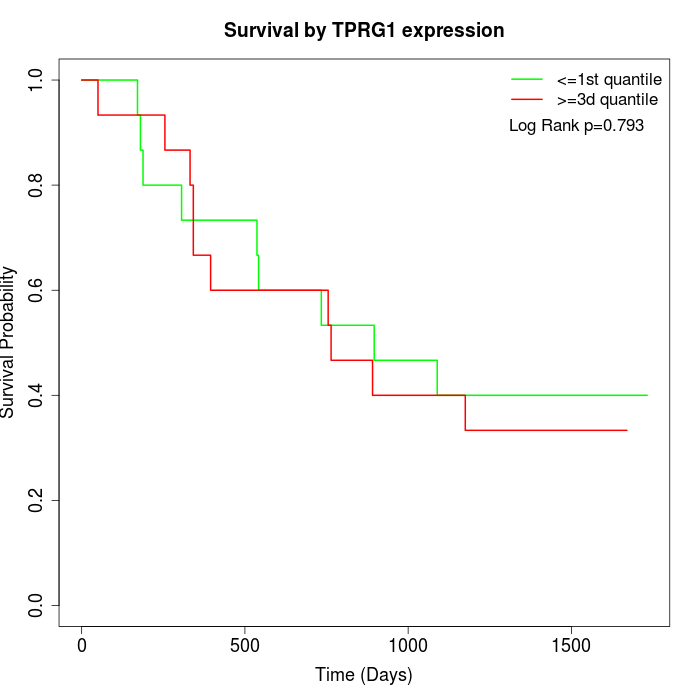 | 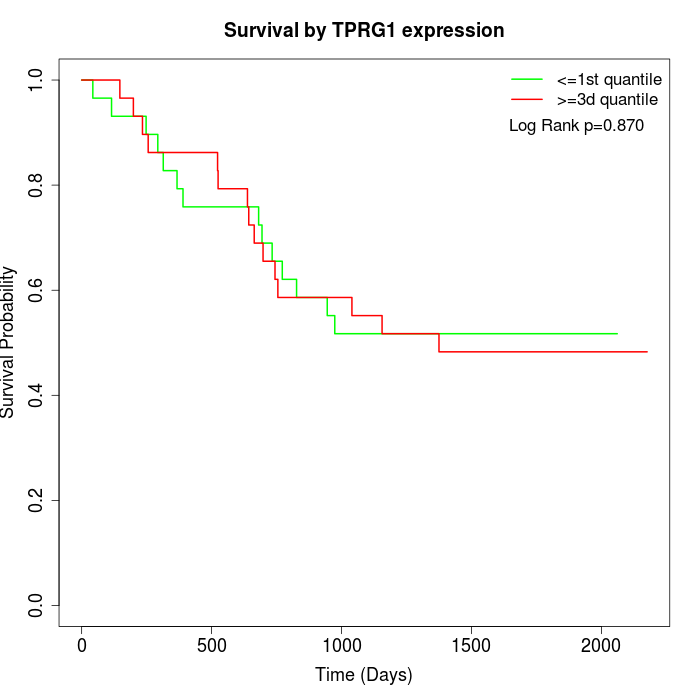 | 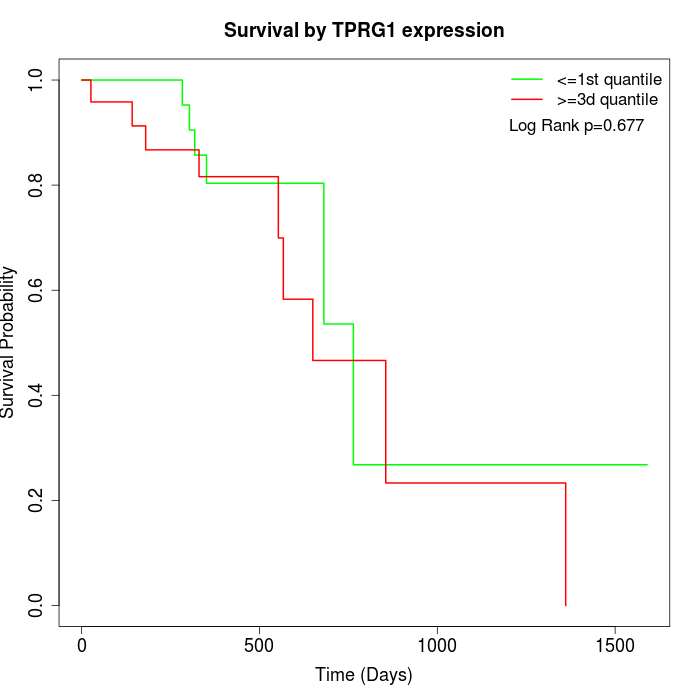 |
| GSE53622 | GSE53624 | TCGA |
Note: Click image to view full size file.
Copy number change of TPRG1:
| Dataset | Gene | EntrezID | Gain | Loss | Normal | Detail |
|---|---|---|---|---|---|---|
| GSE15526 | TPRG1 | 285386 | 25 | 0 | 5 | |
| GSE20123 | TPRG1 | 285386 | 25 | 0 | 5 | |
| GSE43470 | TPRG1 | 285386 | 23 | 0 | 20 | |
| GSE46452 | TPRG1 | 285386 | 19 | 1 | 39 | |
| GSE47630 | TPRG1 | 285386 | 27 | 2 | 11 | |
| GSE54993 | TPRG1 | 285386 | 1 | 19 | 50 | |
| GSE54994 | TPRG1 | 285386 | 39 | 0 | 14 | |
| GSE60625 | TPRG1 | 285386 | 0 | 6 | 5 | |
| GSE74703 | TPRG1 | 285386 | 20 | 0 | 16 | |
| GSE74704 | TPRG1 | 285386 | 17 | 0 | 3 | |
| TCGA | TPRG1 | 285386 | 77 | 1 | 18 |
Total number of gains: 273; Total number of losses: 29; Total Number of normals: 186.
Somatic mutations of TPRG1:
Generating mutation plots.
Highly correlated genes for TPRG1:
Showing top 20/1302 corelated genes with mean PCC>0.5.
| Gene1 | Gene2 | Mean PCC | Num. Datasets | Num. PCC<0 | Num. PCC>0.5 |
|---|---|---|---|---|---|
| TPRG1 | SMAGP | 0.858736 | 6 | 0 | 6 |
| TPRG1 | CEACAM5 | 0.847365 | 6 | 0 | 6 |
| TPRG1 | CEACAM7 | 0.840648 | 6 | 0 | 6 |
| TPRG1 | PRSS27 | 0.831983 | 6 | 0 | 6 |
| TPRG1 | SFTA2 | 0.831555 | 4 | 0 | 4 |
| TPRG1 | ACPP | 0.831105 | 6 | 0 | 6 |
| TPRG1 | ARHGAP27 | 0.82991 | 7 | 0 | 7 |
| TPRG1 | CAPN14 | 0.828763 | 6 | 0 | 6 |
| TPRG1 | CEACAM6 | 0.828403 | 6 | 0 | 6 |
| TPRG1 | ANXA9 | 0.827722 | 7 | 0 | 7 |
| TPRG1 | EMP1 | 0.824681 | 6 | 0 | 6 |
| TPRG1 | SLURP1 | 0.823397 | 6 | 0 | 6 |
| TPRG1 | TTC9 | 0.821204 | 7 | 0 | 7 |
| TPRG1 | SCEL | 0.820913 | 6 | 0 | 6 |
| TPRG1 | ESPL1 | 0.820104 | 6 | 0 | 6 |
| TPRG1 | SLC16A6 | 0.815806 | 7 | 0 | 7 |
| TPRG1 | PRSS2 | 0.815399 | 4 | 0 | 4 |
| TPRG1 | SPNS2 | 0.814191 | 5 | 0 | 5 |
| TPRG1 | TMPRSS11B | 0.810959 | 6 | 0 | 6 |
| TPRG1 | BLNK | 0.809911 | 7 | 0 | 7 |
For details and further investigation, click here