| Full name: phosphofurin acidic cluster sorting protein 1 | Alias Symbol: FLJ10209|KIAA1175 | ||
| Type: protein-coding gene | Cytoband: 11q13.1-q13.2 | ||
| Entrez ID: 55690 | HGNC ID: HGNC:30032 | Ensembl Gene: ENSG00000175115 | OMIM ID: 607492 |
Expression of PACS1:
| Dataset | Gene | EntrezID | Probe | Log2FC | Adj.pValue | Expression |
|---|---|---|---|---|---|---|
| GSE17351 | PACS1 | 55690 | 224658_x_at | 0.5551 | 0.1219 | |
| GSE20347 | PACS1 | 55690 | 220557_s_at | 0.2306 | 0.0051 | |
| GSE23400 | PACS1 | 55690 | 220557_s_at | 0.0636 | 0.0937 | |
| GSE26886 | PACS1 | 55690 | 224658_x_at | 0.3416 | 0.0254 | |
| GSE29001 | PACS1 | 55690 | 220557_s_at | 0.0863 | 0.3742 | |
| GSE38129 | PACS1 | 55690 | 220557_s_at | 0.1213 | 0.0952 | |
| GSE45670 | PACS1 | 55690 | 224658_x_at | 0.0553 | 0.5787 | |
| GSE53622 | PACS1 | 55690 | 58123 | 0.0779 | 0.3382 | |
| GSE53624 | PACS1 | 55690 | 58123 | 0.3292 | 0.0000 | |
| GSE63941 | PACS1 | 55690 | 224658_x_at | 0.1591 | 0.6715 | |
| GSE77861 | PACS1 | 55690 | 224658_x_at | 0.2347 | 0.3992 | |
| GSE97050 | PACS1 | 55690 | A_23_P500282 | 0.2111 | 0.4485 | |
| SRP007169 | PACS1 | 55690 | RNAseq | 0.0039 | 0.9915 | |
| SRP008496 | PACS1 | 55690 | RNAseq | 0.1297 | 0.5561 | |
| SRP064894 | PACS1 | 55690 | RNAseq | 0.2813 | 0.0834 | |
| SRP133303 | PACS1 | 55690 | RNAseq | 0.3670 | 0.1562 | |
| SRP159526 | PACS1 | 55690 | RNAseq | -0.0481 | 0.8331 | |
| SRP193095 | PACS1 | 55690 | RNAseq | 0.5050 | 0.0003 | |
| SRP219564 | PACS1 | 55690 | RNAseq | -0.0819 | 0.8045 | |
| TCGA | PACS1 | 55690 | RNAseq | 0.0191 | 0.6620 |
Upregulated datasets: 0; Downregulated datasets: 0.
Survival by PACS1 expression:
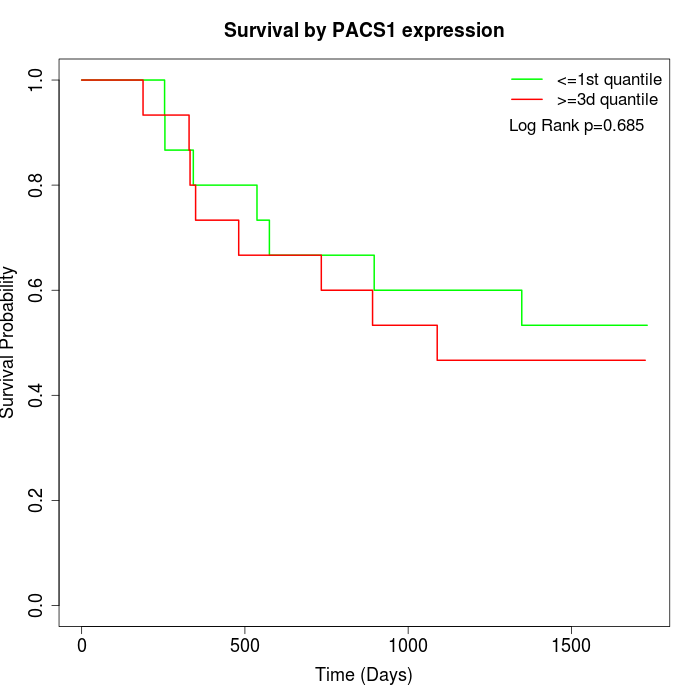 | 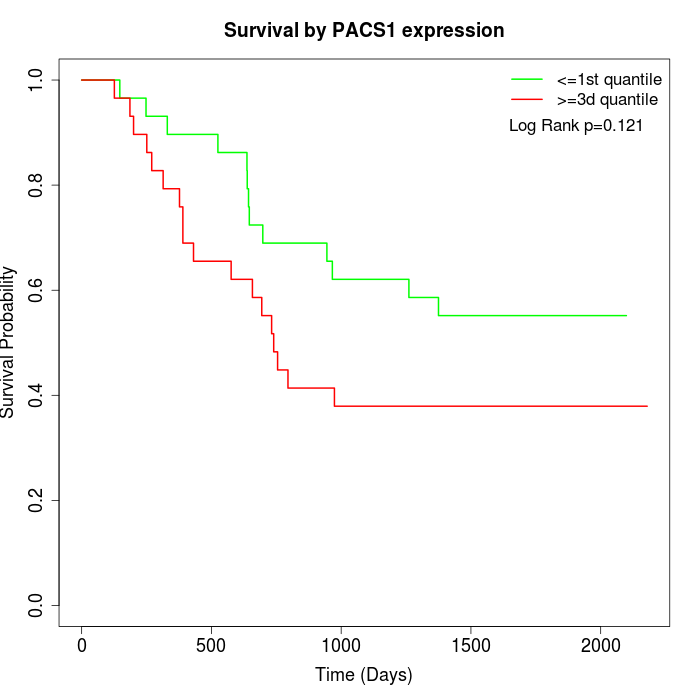 | 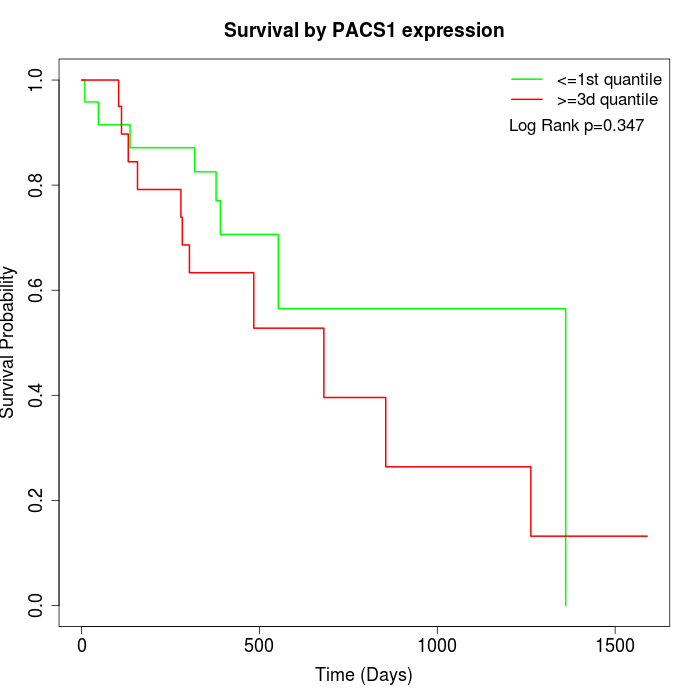 |
| GSE53622 | GSE53624 | TCGA |
Note: Click image to view full size file.
Copy number change of PACS1:
| Dataset | Gene | EntrezID | Gain | Loss | Normal | Detail |
|---|---|---|---|---|---|---|
| GSE15526 | PACS1 | 55690 | 9 | 4 | 17 | |
| GSE20123 | PACS1 | 55690 | 9 | 4 | 17 | |
| GSE43470 | PACS1 | 55690 | 6 | 1 | 36 | |
| GSE46452 | PACS1 | 55690 | 11 | 3 | 45 | |
| GSE47630 | PACS1 | 55690 | 8 | 5 | 27 | |
| GSE54993 | PACS1 | 55690 | 3 | 0 | 67 | |
| GSE54994 | PACS1 | 55690 | 8 | 5 | 40 | |
| GSE60625 | PACS1 | 55690 | 0 | 3 | 8 | |
| GSE74703 | PACS1 | 55690 | 4 | 0 | 32 | |
| GSE74704 | PACS1 | 55690 | 7 | 2 | 11 | |
| TCGA | PACS1 | 55690 | 25 | 6 | 65 |
Total number of gains: 90; Total number of losses: 33; Total Number of normals: 365.
Somatic mutations of PACS1:
Generating mutation plots.
Highly correlated genes for PACS1:
Showing top 20/654 corelated genes with mean PCC>0.5.
| Gene1 | Gene2 | Mean PCC | Num. Datasets | Num. PCC<0 | Num. PCC>0.5 |
|---|---|---|---|---|---|
| PACS1 | MEA1 | 0.864407 | 3 | 0 | 3 |
| PACS1 | HGS | 0.842825 | 3 | 0 | 3 |
| PACS1 | ZNF787 | 0.841312 | 3 | 0 | 3 |
| PACS1 | RAD18 | 0.813483 | 3 | 0 | 3 |
| PACS1 | SLC39A3 | 0.812764 | 3 | 0 | 3 |
| PACS1 | DHPS | 0.810758 | 3 | 0 | 3 |
| PACS1 | DEDD | 0.805718 | 3 | 0 | 3 |
| PACS1 | RNF4 | 0.803168 | 3 | 0 | 3 |
| PACS1 | MCMBP | 0.802223 | 3 | 0 | 3 |
| PACS1 | PRMT1 | 0.787343 | 3 | 0 | 3 |
| PACS1 | TEX261 | 0.785824 | 3 | 0 | 3 |
| PACS1 | KRI1 | 0.784433 | 3 | 0 | 3 |
| PACS1 | RNF220 | 0.780479 | 3 | 0 | 3 |
| PACS1 | NINJ1 | 0.778371 | 3 | 0 | 3 |
| PACS1 | MAP3K13 | 0.775621 | 3 | 0 | 3 |
| PACS1 | RAVER1 | 0.77344 | 4 | 0 | 4 |
| PACS1 | ISOC2 | 0.772171 | 3 | 0 | 3 |
| PACS1 | FASN | 0.771632 | 3 | 0 | 3 |
| PACS1 | CKAP5 | 0.770214 | 3 | 0 | 3 |
| PACS1 | SWT1 | 0.766524 | 3 | 0 | 3 |
For details and further investigation, click here