| Full name: pyruvate dehyrogenase phosphatase catalytic subunit 2 | Alias Symbol: KIAA1348|PPM2C2|PPM2B | ||
| Type: protein-coding gene | Cytoband: 16q22.1 | ||
| Entrez ID: 57546 | HGNC ID: HGNC:30263 | Ensembl Gene: ENSG00000172840 | OMIM ID: 615499 |
Expression of PDP2:
| Dataset | Gene | EntrezID | Probe | Log2FC | Adj.pValue | Expression |
|---|---|---|---|---|---|---|
| GSE17351 | PDP2 | 57546 | 226855_at | 0.5089 | 0.1862 | |
| GSE26886 | PDP2 | 57546 | 226855_at | 0.3154 | 0.1234 | |
| GSE45670 | PDP2 | 57546 | 226855_at | 0.0745 | 0.6251 | |
| GSE53622 | PDP2 | 57546 | 79828 | -0.0043 | 0.9627 | |
| GSE53624 | PDP2 | 57546 | 79828 | 0.1087 | 0.3296 | |
| GSE63941 | PDP2 | 57546 | 226855_at | -0.2313 | 0.6130 | |
| GSE77861 | PDP2 | 57546 | 226855_at | 0.0797 | 0.3339 | |
| GSE97050 | PDP2 | 57546 | A_33_P3251685 | 0.1096 | 0.5702 | |
| SRP007169 | PDP2 | 57546 | RNAseq | 0.1008 | 0.8020 | |
| SRP008496 | PDP2 | 57546 | RNAseq | 0.2701 | 0.3566 | |
| SRP064894 | PDP2 | 57546 | RNAseq | -0.2830 | 0.1376 | |
| SRP133303 | PDP2 | 57546 | RNAseq | 0.1199 | 0.3986 | |
| SRP159526 | PDP2 | 57546 | RNAseq | 0.1959 | 0.5765 | |
| SRP193095 | PDP2 | 57546 | RNAseq | 0.0991 | 0.3147 | |
| SRP219564 | PDP2 | 57546 | RNAseq | 0.4576 | 0.3593 | |
| TCGA | PDP2 | 57546 | RNAseq | -0.0345 | 0.6427 |
Upregulated datasets: 0; Downregulated datasets: 0.
Survival by PDP2 expression:
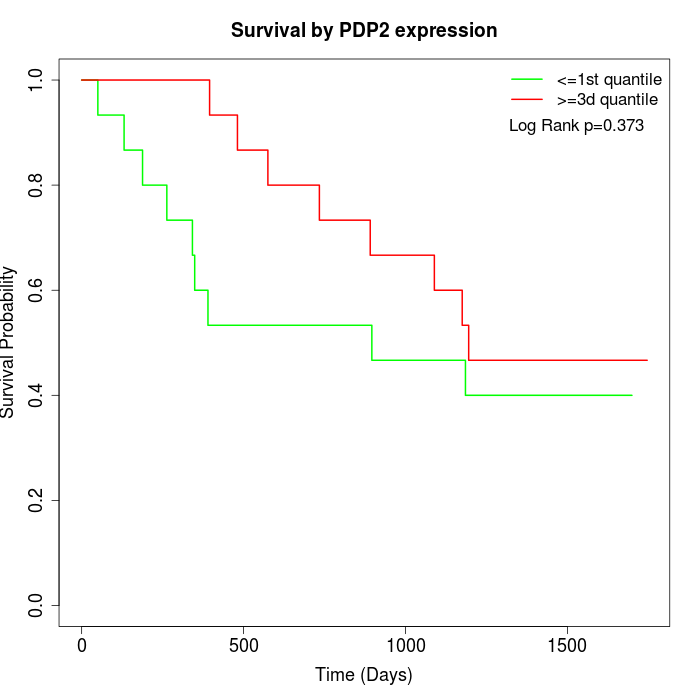 | 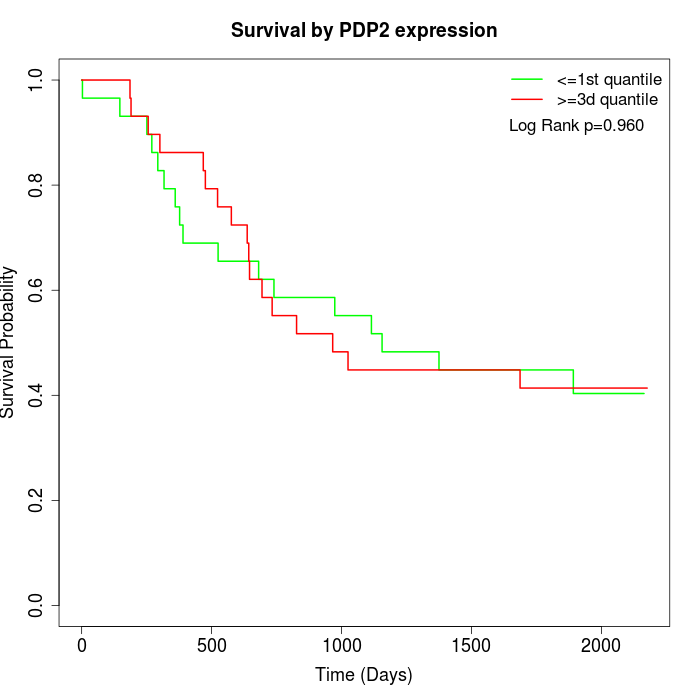 | 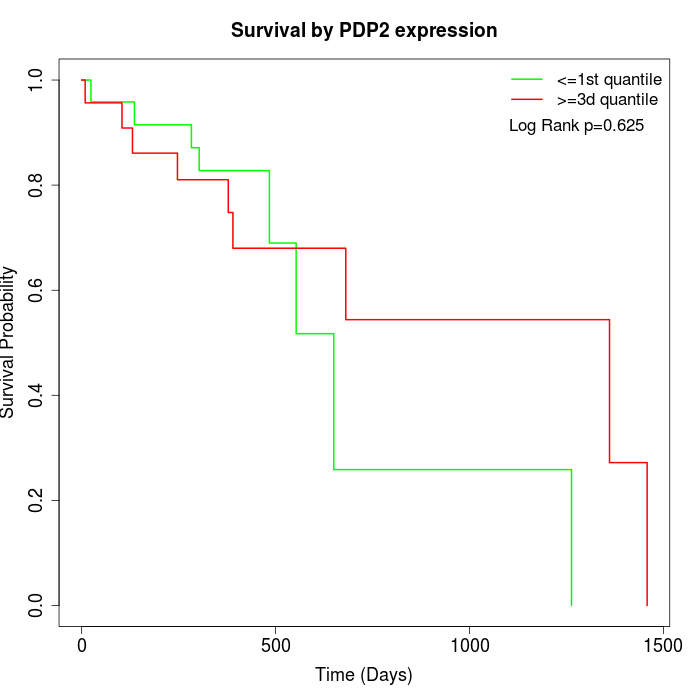 |
| GSE53622 | GSE53624 | TCGA |
Note: Click image to view full size file.
Copy number change of PDP2:
| Dataset | Gene | EntrezID | Gain | Loss | Normal | Detail |
|---|---|---|---|---|---|---|
| GSE15526 | PDP2 | 57546 | 8 | 2 | 20 | |
| GSE20123 | PDP2 | 57546 | 8 | 2 | 20 | |
| GSE43470 | PDP2 | 57546 | 1 | 8 | 34 | |
| GSE46452 | PDP2 | 57546 | 38 | 1 | 20 | |
| GSE47630 | PDP2 | 57546 | 10 | 8 | 22 | |
| GSE54993 | PDP2 | 57546 | 2 | 4 | 64 | |
| GSE54994 | PDP2 | 57546 | 8 | 10 | 35 | |
| GSE60625 | PDP2 | 57546 | 4 | 0 | 7 | |
| GSE74703 | PDP2 | 57546 | 1 | 5 | 30 | |
| GSE74704 | PDP2 | 57546 | 5 | 1 | 14 | |
| TCGA | PDP2 | 57546 | 31 | 11 | 54 |
Total number of gains: 116; Total number of losses: 52; Total Number of normals: 320.
Somatic mutations of PDP2:
Generating mutation plots.
Highly correlated genes for PDP2:
Showing top 20/66 corelated genes with mean PCC>0.5.
| Gene1 | Gene2 | Mean PCC | Num. Datasets | Num. PCC<0 | Num. PCC>0.5 |
|---|---|---|---|---|---|
| PDP2 | NUP88 | 0.675884 | 3 | 0 | 3 |
| PDP2 | ZNF146 | 0.671938 | 3 | 0 | 3 |
| PDP2 | BPNT1 | 0.663834 | 3 | 0 | 3 |
| PDP2 | RAD9A | 0.651868 | 3 | 0 | 3 |
| PDP2 | PDCD2L | 0.641477 | 3 | 0 | 3 |
| PDP2 | BRI3BP | 0.640336 | 4 | 0 | 4 |
| PDP2 | PSAT1 | 0.633748 | 4 | 0 | 3 |
| PDP2 | SHROOM2 | 0.632374 | 3 | 0 | 3 |
| PDP2 | PRPS2 | 0.627901 | 3 | 0 | 3 |
| PDP2 | ZNF512B | 0.616702 | 4 | 0 | 3 |
| PDP2 | PTPN4 | 0.614068 | 3 | 0 | 3 |
| PDP2 | JPH1 | 0.61177 | 3 | 0 | 3 |
| PDP2 | ZNF184 | 0.60992 | 3 | 0 | 3 |
| PDP2 | PFAS | 0.608756 | 4 | 0 | 4 |
| PDP2 | AHCTF1 | 0.607839 | 3 | 0 | 3 |
| PDP2 | GSR | 0.603033 | 3 | 0 | 3 |
| PDP2 | MTPAP | 0.600057 | 3 | 0 | 3 |
| PDP2 | ATAD5 | 0.598247 | 3 | 0 | 3 |
| PDP2 | NOP58 | 0.597978 | 3 | 0 | 3 |
| PDP2 | CMTM8 | 0.596786 | 3 | 0 | 3 |
For details and further investigation, click here