| Full name: protein inhibitor of activated STAT 2 | Alias Symbol: PIASX-BETA|miz|PIASX-ALPHA|ZMIZ4|ARIP3 | ||
| Type: protein-coding gene | Cytoband: 18q21.1 | ||
| Entrez ID: 9063 | HGNC ID: HGNC:17311 | Ensembl Gene: ENSG00000078043 | OMIM ID: 603567 |
PIAS2 involved pathways:
| KEGG pathway | Description | View |
|---|---|---|
| hsa04630 | Jak-STAT signaling pathway | |
| hsa05200 | Pathways in cancer | |
| hsa05222 | Small cell lung cancer |
Expression of PIAS2:
| Dataset | Gene | EntrezID | Probe | Log2FC | Adj.pValue | Expression |
|---|---|---|---|---|---|---|
| GSE17351 | PIAS2 | 9063 | 214442_s_at | -0.6618 | 0.4542 | |
| GSE20347 | PIAS2 | 9063 | 214442_s_at | 0.0700 | 0.5205 | |
| GSE23400 | PIAS2 | 9063 | 214442_s_at | 0.0296 | 0.5583 | |
| GSE26886 | PIAS2 | 9063 | 214442_s_at | -0.0818 | 0.7463 | |
| GSE29001 | PIAS2 | 9063 | 214442_s_at | -0.2621 | 0.1364 | |
| GSE38129 | PIAS2 | 9063 | 214442_s_at | 0.0679 | 0.5538 | |
| GSE45670 | PIAS2 | 9063 | 235107_at | -0.1041 | 0.6377 | |
| GSE53622 | PIAS2 | 9063 | 48814 | 0.0338 | 0.7146 | |
| GSE53624 | PIAS2 | 9063 | 48814 | 0.2657 | 0.0003 | |
| GSE63941 | PIAS2 | 9063 | 1555514_a_at | 0.4585 | 0.4530 | |
| GSE77861 | PIAS2 | 9063 | 214442_s_at | 0.2641 | 0.1943 | |
| GSE97050 | PIAS2 | 9063 | A_33_P3349269 | -0.2306 | 0.4950 | |
| SRP007169 | PIAS2 | 9063 | RNAseq | 0.3602 | 0.5515 | |
| SRP008496 | PIAS2 | 9063 | RNAseq | 1.2522 | 0.0098 | |
| SRP064894 | PIAS2 | 9063 | RNAseq | 0.0872 | 0.5451 | |
| SRP133303 | PIAS2 | 9063 | RNAseq | 0.1610 | 0.4954 | |
| SRP159526 | PIAS2 | 9063 | RNAseq | 0.7500 | 0.1297 | |
| SRP193095 | PIAS2 | 9063 | RNAseq | 0.2560 | 0.0182 | |
| SRP219564 | PIAS2 | 9063 | RNAseq | -0.2626 | 0.3189 | |
| TCGA | PIAS2 | 9063 | RNAseq | -0.1019 | 0.2436 |
Upregulated datasets: 1; Downregulated datasets: 0.
Survival by PIAS2 expression:
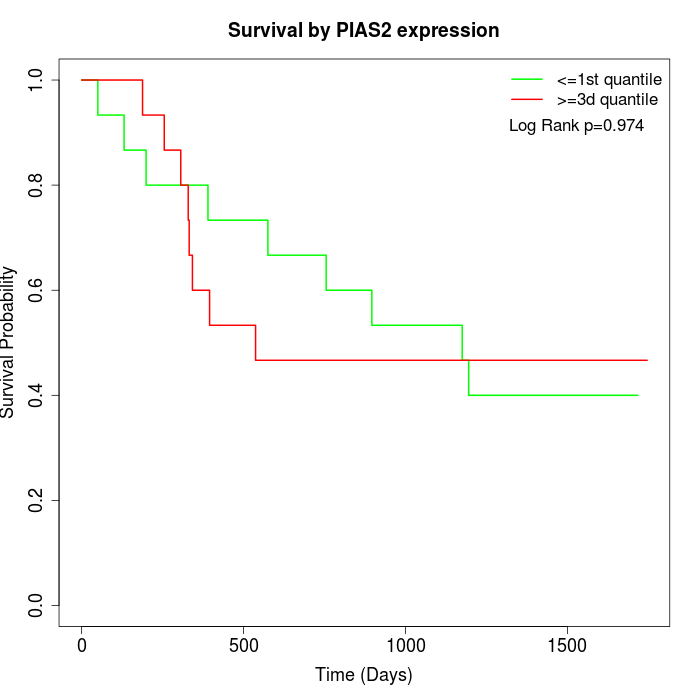 | 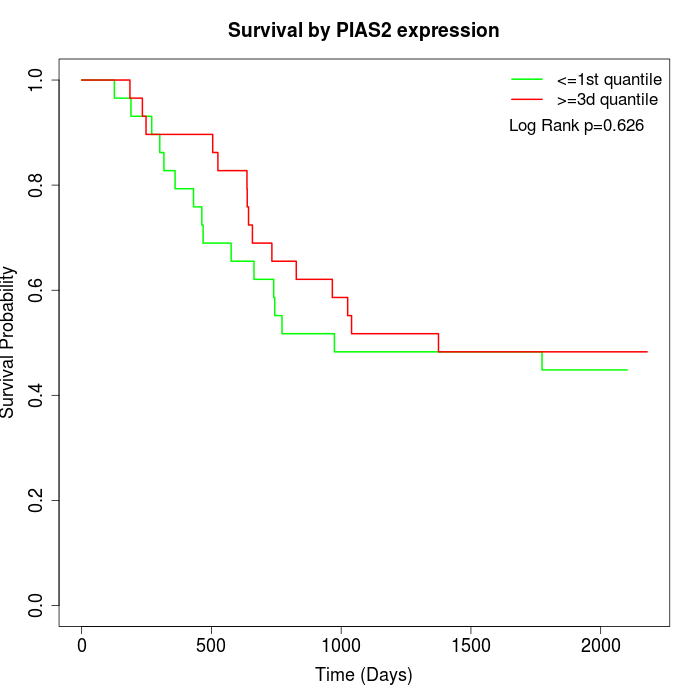 | 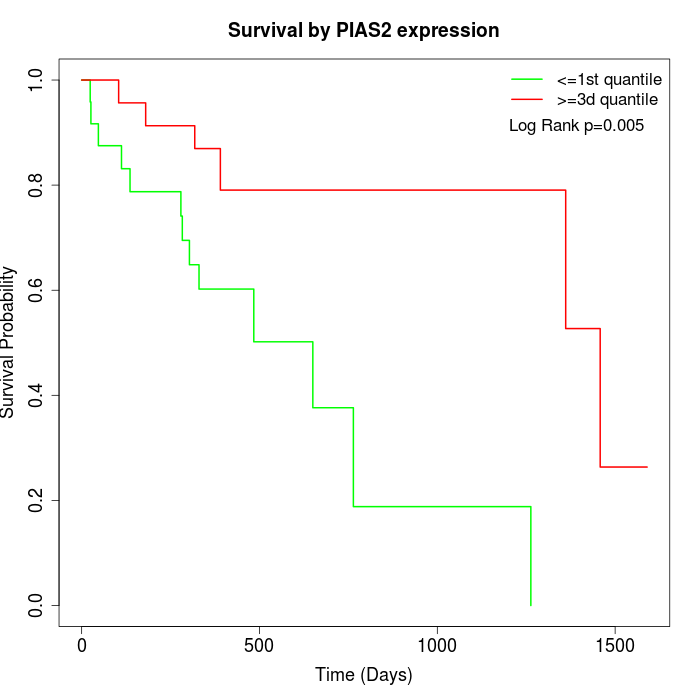 |
| GSE53622 | GSE53624 | TCGA |
Note: Click image to view full size file.
Copy number change of PIAS2:
| Dataset | Gene | EntrezID | Gain | Loss | Normal | Detail |
|---|---|---|---|---|---|---|
| GSE15526 | PIAS2 | 9063 | 1 | 8 | 21 | |
| GSE20123 | PIAS2 | 9063 | 1 | 8 | 21 | |
| GSE43470 | PIAS2 | 9063 | 0 | 5 | 38 | |
| GSE46452 | PIAS2 | 9063 | 1 | 26 | 32 | |
| GSE47630 | PIAS2 | 9063 | 5 | 20 | 15 | |
| GSE54993 | PIAS2 | 9063 | 8 | 1 | 61 | |
| GSE54994 | PIAS2 | 9063 | 3 | 14 | 36 | |
| GSE60625 | PIAS2 | 9063 | 0 | 4 | 7 | |
| GSE74703 | PIAS2 | 9063 | 0 | 4 | 32 | |
| GSE74704 | PIAS2 | 9063 | 0 | 6 | 14 | |
| TCGA | PIAS2 | 9063 | 15 | 39 | 42 |
Total number of gains: 34; Total number of losses: 135; Total Number of normals: 319.
Somatic mutations of PIAS2:
Generating mutation plots.
Highly correlated genes for PIAS2:
Showing top 20/141 corelated genes with mean PCC>0.5.
| Gene1 | Gene2 | Mean PCC | Num. Datasets | Num. PCC<0 | Num. PCC>0.5 |
|---|---|---|---|---|---|
| PIAS2 | MAPK10 | 0.787455 | 3 | 0 | 3 |
| PIAS2 | RTF1 | 0.755655 | 3 | 0 | 3 |
| PIAS2 | DTWD1 | 0.729393 | 3 | 0 | 3 |
| PIAS2 | DLG5 | 0.728415 | 3 | 0 | 3 |
| PIAS2 | STOML2 | 0.717378 | 3 | 0 | 3 |
| PIAS2 | SOX5 | 0.71581 | 3 | 0 | 3 |
| PIAS2 | POLR2C | 0.713415 | 3 | 0 | 3 |
| PIAS2 | KLHL13 | 0.703565 | 4 | 0 | 3 |
| PIAS2 | GDE1 | 0.703257 | 3 | 0 | 3 |
| PIAS2 | PYGO1 | 0.69853 | 3 | 0 | 3 |
| PIAS2 | GSPT2 | 0.693655 | 4 | 0 | 4 |
| PIAS2 | CDS2 | 0.689148 | 3 | 0 | 3 |
| PIAS2 | IMMT | 0.685773 | 4 | 0 | 3 |
| PIAS2 | PRR14 | 0.683668 | 3 | 0 | 3 |
| PIAS2 | CEP57 | 0.680099 | 4 | 0 | 4 |
| PIAS2 | NDUFAF1 | 0.677763 | 3 | 0 | 3 |
| PIAS2 | MXRA7 | 0.67714 | 3 | 0 | 3 |
| PIAS2 | MORF4L1 | 0.672567 | 4 | 0 | 3 |
| PIAS2 | MTFMT | 0.670532 | 5 | 0 | 4 |
| PIAS2 | PSMD7 | 0.669202 | 3 | 0 | 3 |
For details and further investigation, click here